|
Download Data (XLS File) |
|
||||||||
|
||||||||
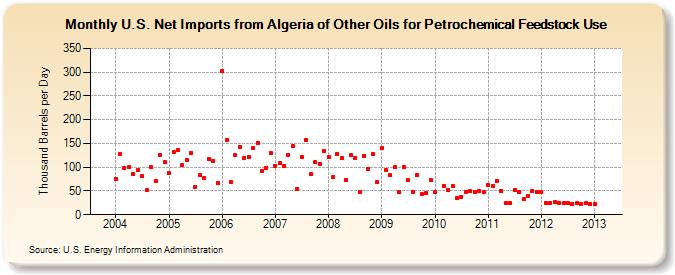
| U.S. Net Imports from Algeria of Other Oils for Petrochemical Feedstock Use (Thousand Barrels per Day) | ||||||||
| Year | Jan | Feb | Mar | Apr | May | Jun | Jul | Aug | Sep | Oct | Nov | Dec |
|---|---|---|---|---|---|---|---|---|---|---|---|---|
| 2004 | 75 | 128 | 98 | 100 | 86 | 94 | 82 | 51 | 100 | 71 | 126 | 110 |
| 2005 | 87 | 132 | 136 | 104 | 116 | 130 | 58 | 83 | 78 | 118 | 113 | 67 |
| 2006 | 302 | 158 | 69 | 125 | 143 | 119 | 121 | 140 | 151 | 92 | 99 | 130 |
| 2007 | 103 | 109 | 103 | 126 | 145 | 54 | 122 | 158 | 85 | 110 | 107 | 135 |
| 2008 | 121 | 79 | 128 | 119 | 74 | 125 | 120 | 47 | 124 | 97 | 127 | 68 |
| 2009 | 140 | 94 | 83 | 100 | 48 | 100 | 73 | 47 | 83 | 44 | 45 | 73 |
| 2010 | 48 | 61 | 53 | 60 | 35 | 38 | 48 | 49 | 48 | 50 | 48 | |
| 2011 | 63 | 61 | 71 | 49 | 24 | 24 | 52 | 48 | 33 | 40 | 49 | 47 |
| 2012 | 47 | 25 | 24 | 26 | 24 | 24 | 24 | 23 | 24 | 23 | 24 | 23 |
| 2013 | 23 | |||||||||||
| - = No Data Reported; -- = Not Applicable; NA = Not Available; W = Withheld to avoid disclosure of individual company data. |
| Release Date: 8/30/2024 |
| Next Release Date: 9/30/2024 |