|
Download Data (XLS File) |
|
||||||||
|
||||||||
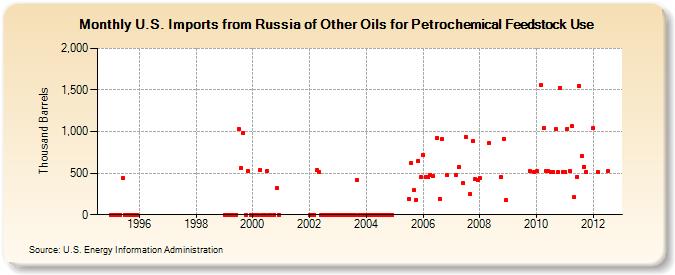
| U.S. Imports from Russia of Other Oils for Petrochemical Feedstock Use (Thousand Barrels) | ||||||||
| Year | Jan | Feb | Mar | Apr | May | Jun | Jul | Aug | Sep | Oct | Nov | Dec |
|---|---|---|---|---|---|---|---|---|---|---|---|---|
| 1995 | 0 | 0 | 0 | 0 | 0 | 440 | 0 | 0 | 0 | 0 | 0 | 0 |
| 1999 | 0 | 0 | 0 | 0 | 0 | 0 | 1,032 | 562 | 983 | 0 | 530 | 0 |
| 2000 | 0 | 0 | 0 | 533 | 0 | 0 | 528 | 0 | 0 | 0 | 320 | 0 |
| 2002 | 0 | 0 | 0 | 535 | 516 | 0 | 0 | 0 | 0 | 0 | 0 | 0 |
| 2003 | 0 | 0 | 0 | 0 | 0 | 0 | 0 | 0 | 416 | 0 | 0 | 0 |
| 2004 | 0 | 0 | 0 | 0 | 0 | 0 | 0 | 0 | 0 | 0 | 0 | 0 |
| 2005 | 192 | 626 | 294 | 180 | 649 | 455 | ||||||
| 2006 | 717 | 454 | 448 | 480 | 467 | 921 | 194 | 913 | 473 | |||
| 2007 | 478 | 571 | 381 | 938 | 250 | 881 | 425 | 418 | ||||
| 2008 | 437 | 861 | 450 | 915 | 171 | |||||||
| 2009 | 522 | 517 | ||||||||||
| 2010 | 522 | 1,554 | 1,040 | 523 | 523 | 517 | 518 | 1,032 | 508 | 1,528 | 514 | |
| 2011 | 519 | 1,034 | 524 | 1,067 | 207 | 454 | 1,549 | 712 | 577 | 515 | ||
| 2012 | 1,038 | 509 | 522 | |||||||||
| - = No Data Reported; -- = Not Applicable; NA = Not Available; W = Withheld to avoid disclosure of individual company data. |
| Release Date: 6/28/2024 |
| Next Release Date: 7/31/2024 |