|
Download Data (XLS File) |
|
||||||||
|
||||||||
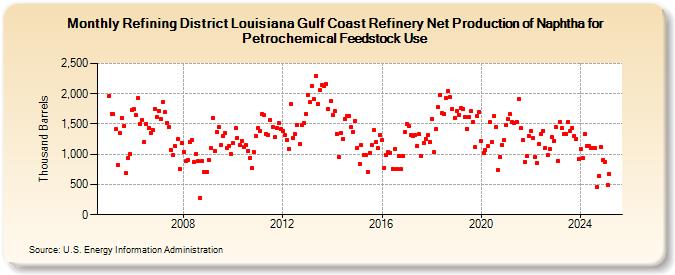
| Refining District Louisiana Gulf Coast Refinery Net Production of Naphtha for Petrochemical Feedstock Use (Thousand Barrels) | ||||||||
| Year | Jan | Feb | Mar | Apr | May | Jun | Jul | Aug | Sep | Oct | Nov | Dec |
|---|---|---|---|---|---|---|---|---|---|---|---|---|
| 2005 | 1,968 | 1,669 | 1,658 | 1,411 | 822 | 1,355 | 1,607 | 1,470 | 684 | 939 | 997 | 1,723 |
| 2006 | 1,741 | 1,644 | 1,924 | 1,501 | 1,568 | 1,199 | 1,500 | 1,429 | 1,343 | 1,403 | 1,754 | 1,619 |
| 2007 | 1,719 | 1,575 | 1,856 | 1,691 | 1,524 | 1,446 | 1,065 | 980 | 1,129 | 1,247 | 758 | 1,187 |
| 2008 | 1,038 | 881 | 911 | 1,197 | 1,234 | 869 | 1,009 | 882 | 284 | 891 | 705 | 701 |
| 2009 | 912 | 1,098 | 1,607 | 1,057 | 1,367 | 1,444 | 1,159 | 1,296 | 1,350 | 1,111 | 1,138 | 1,002 |
| 2010 | 1,183 | 1,429 | 1,272 | 1,155 | 1,223 | 1,112 | 1,150 | 1,058 | 934 | 774 | 1,032 | 1,295 |
| 2011 | 1,429 | 1,382 | 1,666 | 1,646 | 1,341 | 1,311 | 1,563 | 1,455 | 1,277 | 1,428 | 1,514 | 1,409 |
| 2012 | 1,383 | 1,317 | 1,230 | 1,093 | 1,827 | 1,269 | 1,327 | 1,486 | 1,169 | 1,482 | 1,515 | 1,663 |
| 2013 | 1,980 | 1,858 | 2,121 | 1,905 | 2,290 | 1,834 | 2,056 | 2,143 | 2,126 | 2,166 | 1,746 | 1,879 |
| 2014 | 1,646 | 1,708 | 1,340 | 952 | 1,359 | 1,248 | 1,575 | 1,628 | 1,639 | 1,446 | 1,371 | 1,547 |
| 2015 | 1,108 | 846 | 1,147 | 984 | 983 | 709 | 1,022 | 1,153 | 1,394 | 1,200 | 1,098 | 1,313 |
| 2016 | 1,235 | 778 | 985 | 1,039 | 1,028 | 762 | 1,082 | 756 | 975 | 748 | 970 | 1,367 |
| 2017 | 1,507 | 1,462 | 1,319 | 1,304 | 1,314 | 1,137 | 1,330 | 963 | 1,185 | 1,252 | 1,312 | 1,199 |
| 2018 | 1,575 | 1,030 | 1,410 | 1,775 | 1,973 | 1,677 | 1,664 | 1,929 | 2,048 | 1,941 | 1,754 | 1,603 |
| 2019 | 1,721 | 1,655 | 1,759 | 1,752 | 1,623 | 1,420 | 1,612 | 1,710 | 1,530 | 1,114 | 1,637 | 1,702 |
| 2020 | 1,215 | 1,022 | 1,068 | 1,136 | 1,528 | 1,206 | 1,627 | 1,448 | 744 | 957 | 1,157 | 1,230 |
| 2021 | 1,478 | 1,583 | 1,663 | 1,537 | 1,516 | 1,539 | 1,907 | 1,433 | 1,233 | 872 | 973 | 1,303 |
| 2022 | 1,380 | 1,261 | 949 | 852 | 1,167 | 1,332 | 1,387 | 1,109 | 987 | 1,089 | 1,279 | 1,217 |
| 2023 | 1,443 | 890 | 1,538 | 1,441 | 1,330 | 1,342 | 1,535 | 1,390 | 1,434 | 1,306 | 1,253 | 917 |
| 2024 | 1,080 | |||||||||||
| - = No Data Reported; -- = Not Applicable; NA = Not Available; W = Withheld to avoid disclosure of individual company data. |
| Release Date: 3/29/2024 |
| Next Release Date: 4/30/2024 |