|
Download Data (XLS File) |
|
||||||||
|
||||||||
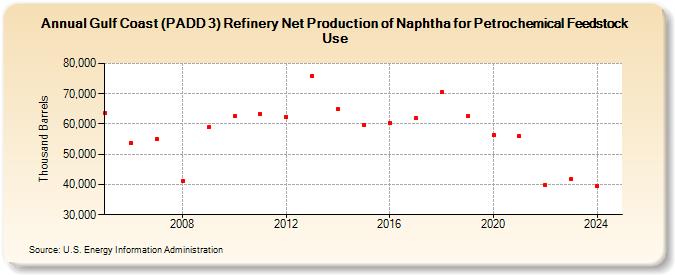
| Gulf Coast (PADD 3) Refinery Net Production of Naphtha for Petrochemical Feedstock Use (Thousand Barrels) | ||||||||
| Decade | Year-0 | Year-1 | Year-2 | Year-3 | Year-4 | Year-5 | Year-6 | Year-7 | Year-8 | Year-9 |
|---|---|---|---|---|---|---|---|---|---|---|
| 2000's | 63,607 | 53,646 | 55,044 | 41,212 | 58,835 | |||||
| 2010's | 62,484 | 63,251 | 62,275 | 75,845 | 64,858 | 59,740 | 60,382 | 61,911 | 70,518 | 62,512 |
| 2020's | 56,216 | 55,943 | 39,867 | 41,898 |
| - = No Data Reported; -- = Not Applicable; NA = Not Available; W = Withheld to avoid disclosure of individual company data. |
| Release Date: 6/28/2024 |
| Next Release Date: 8/30/2024 |