|
Download Data (XLS File) |
|
||||||||
|
||||||||
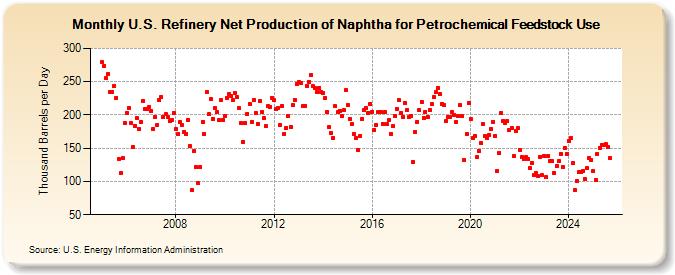
| U.S. Refinery Net Production of Naphtha for Petrochemical Feedstock Use (Thousand Barrels per Day) | ||||||||
| Year | Jan | Feb | Mar | Apr | May | Jun | Jul | Aug | Sep | Oct | Nov | Dec |
|---|---|---|---|---|---|---|---|---|---|---|---|---|
| 2005 | 279 | 274 | 255 | 261 | 234 | 235 | 244 | 226 | 134 | 112 | 135 | 188 |
| 2006 | 203 | 211 | 188 | 152 | 184 | 195 | 179 | 190 | 221 | 209 | 209 | 212 |
| 2007 | 206 | 179 | 197 | 185 | 222 | 227 | 197 | 201 | 197 | 191 | 193 | 203 |
| 2008 | 179 | 171 | 189 | 185 | 175 | 172 | 193 | 153 | 87 | 146 | 121 | 97 |
| 2009 | 121 | 190 | 171 | 234 | 201 | 224 | 194 | 210 | 204 | 193 | 222 | 193 |
| 2010 | 198 | 226 | 231 | 228 | 222 | 233 | 227 | 210 | 188 | 159 | 188 | 202 |
| 2011 | 217 | 190 | 223 | 203 | 187 | 221 | 204 | 195 | 183 | 213 | 212 | 226 |
| 2012 | 222 | 209 | 211 | 185 | 214 | 172 | 181 | 198 | 182 | 215 | 223 | 247 |
| 2013 | 249 | 248 | 213 | 214 | 244 | 250 | 260 | 243 | 240 | 235 | 241 | 235 |
| 2014 | 233 | 226 | 205 | 182 | 173 | 166 | 213 | 204 | 206 | 199 | 207 | 237 |
| 2015 | 215 | 194 | 186 | 172 | 165 | 148 | 168 | 194 | 208 | 210 | 203 | 217 |
| 2016 | 205 | 178 | 185 | 204 | 204 | 187 | 204 | 186 | 192 | 172 | 183 | 198 |
| 2017 | 209 | 222 | 203 | 197 | 218 | 208 | 197 | 199 | 129 | 175 | 190 | 207 |
| 2018 | 220 | 196 | 205 | 197 | 207 | 216 | 227 | 234 | 241 | 231 | 217 | 215 |
| 2019 | 191 | 197 | 197 | 204 | 200 | 190 | 199 | 215 | 198 | 132 | 171 | 218 |
| 2020 | 194 | 165 | 169 | 136 | 146 | 158 | 187 | 168 | 166 | 170 | 179 | 190 |
| 2021 | 169 | 116 | 143 | 203 | 191 | 188 | 191 | 178 | 180 | 138 | 176 | 180 |
| 2022 | 148 | 136 | 134 | 136 | 134 | 120 | 128 | 109 | 112 | 108 | 137 | 109 |
| 2023 | 139 | 106 | 139 | 130 | 130 | 113 | 123 | 130 | 142 | 122 | 153 | 142 |
| 2024 | 161 | |||||||||||
| - = No Data Reported; -- = Not Applicable; NA = Not Available; W = Withheld to avoid disclosure of individual company data. |
| Release Date: 3/29/2024 |
| Next Release Date: 4/30/2024 |