|
Download Data (XLS File) |
|
||||||||
|
||||||||
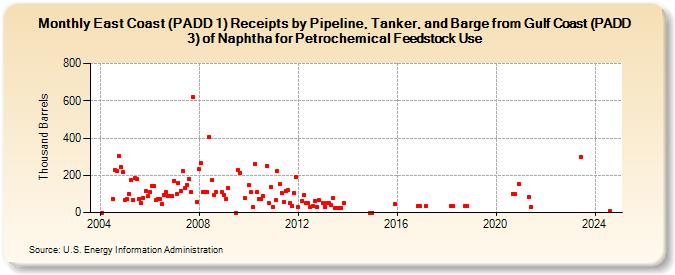
| East Coast (PADD 1) Receipts by Pipeline, Tanker, and Barge from Gulf Coast (PADD 3) of Naphtha for Petrochemical Feedstock Use (Thousand Barrels) | ||||||||
| Year | Jan | Feb | Mar | Apr | May | Jun | Jul | Aug | Sep | Oct | Nov | Dec |
|---|---|---|---|---|---|---|---|---|---|---|---|---|
| 2004 | 0 | 75 | 228 | 222 | 301 | 247 | 216 | |||||
| 2005 | 65 | 72 | 101 | 174 | 67 | 185 | 178 | 73 | 50 | 80 | 116 | 88 |
| 2006 | 110 | 144 | 141 | 65 | 73 | 73 | 45 | 94 | 110 | 87 | 87 | 87 |
| 2007 | 170 | 98 | 160 | 116 | 224 | 130 | 150 | 182 | 108 | 622 | 58 | |
| 2008 | 232 | 264 | 109 | 109 | 109 | 407 | 175 | 93 | 109 | 108 | ||
| 2009 | 94 | 73 | 131 | 0 | 228 | 214 | 76 | |||||
| 2010 | 147 | 109 | 29 | 262 | 108 | 73 | 74 | 87 | 252 | 49 | 139 | |
| 2011 | 32 | 65 | 223 | 151 | 106 | 56 | 116 | 119 | 49 | 33 | 106 | 192 |
| 2012 | 31 | 61 | 94 | 49 | 49 | 32 | 33 | 63 | 32 | 65 | ||
| 2013 | 51 | 30 | 51 | 50 | 38 | 76 | 26 | 27 | 26 | 27 | 53 | |
| 2014 | 0 | |||||||||||
| 2015 | 0 | 48 | ||||||||||
| 2016 | 36 | 36 | ||||||||||
| 2017 | 36 | |||||||||||
| 2018 | 36 | 36 | 36 | 36 | ||||||||
| 2020 | 100 | 100 | 154 | |||||||||
| 2021 | 82 | 29 | ||||||||||
| 2023 | 300 | |||||||||||
| - = No Data Reported; -- = Not Applicable; NA = Not Available; W = Withheld to avoid disclosure of individual company data. |
| Release Date: 6/28/2024 |
| Next Release Date: 7/31/2024 |