|
Download Data (XLS File) |
|
||||||||
|
||||||||
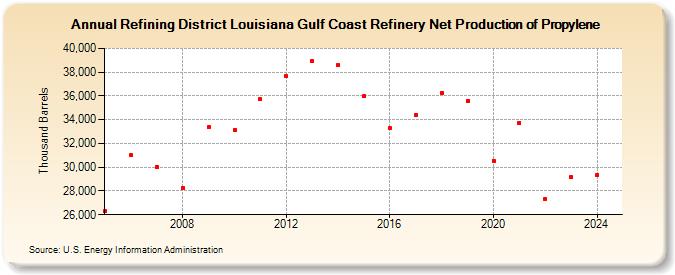
| Refining District Louisiana Gulf Coast Refinery Net Production of Propylene (Thousand Barrels) | ||||||||
| Decade | Year-0 | Year-1 | Year-2 | Year-3 | Year-4 | Year-5 | Year-6 | Year-7 | Year-8 | Year-9 |
|---|---|---|---|---|---|---|---|---|---|---|
| 2000's | 26,281 | 31,017 | 30,028 | 28,233 | 33,371 | |||||
| 2010's | 33,117 | 35,710 | 37,646 | 38,916 | 38,612 | 35,967 | 33,261 | 34,407 | 36,279 | 35,612 |
| 2020's | 30,553 | 33,724 | 27,336 | 29,142 |
| - = No Data Reported; -- = Not Applicable; NA = Not Available; W = Withheld to avoid disclosure of individual company data. |
| Release Date: 6/28/2024 |
| Next Release Date: 8/30/2024 |