|
Download Data (XLS File) |
|
||||||||
|
||||||||
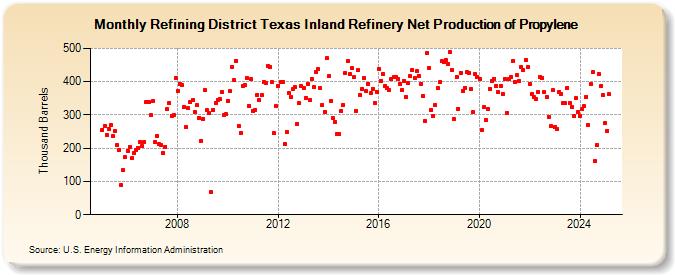
| Refining District Texas Inland Refinery Net Production of Propylene (Thousand Barrels) | ||||||||
| Year | Jan | Feb | Mar | Apr | May | Jun | Jul | Aug | Sep | Oct | Nov | Dec |
|---|---|---|---|---|---|---|---|---|---|---|---|---|
| 2005 | 256 | 266 | 241 | 259 | 269 | 237 | 253 | 210 | 196 | 88 | 133 | 173 |
| 2006 | 193 | 204 | 170 | 187 | 195 | 201 | 218 | 207 | 219 | 338 | 338 | 299 |
| 2007 | 341 | 219 | 237 | 213 | 210 | 187 | 205 | 317 | 336 | 296 | 300 | 412 |
| 2008 | 373 | 393 | 390 | 324 | 264 | 320 | 338 | 345 | 309 | 329 | 292 | 222 |
| 2009 | 288 | 374 | 314 | 305 | 67 | 316 | 337 | 345 | 347 | 368 | 299 | 302 |
| 2010 | 343 | 371 | 445 | 404 | 463 | 267 | 245 | 388 | 389 | 411 | 328 | 407 |
| 2011 | 313 | 316 | 361 | 344 | 359 | 400 | 397 | 448 | 444 | 398 | 245 | 326 |
| 2012 | 388 | 399 | 398 | 214 | 248 | 365 | 354 | 378 | 383 | 273 | 335 | 386 |
| 2013 | 380 | 352 | 393 | 346 | 408 | 383 | 430 | 438 | 380 | 330 | 310 | 470 |
| 2014 | 416 | 342 | 292 | 280 | 243 | 242 | 312 | 330 | 426 | 462 | 423 | 441 |
| 2015 | 413 | 313 | 434 | 359 | 378 | 412 | 371 | 394 | 366 | 379 | 337 | 370 |
| 2016 | 439 | 403 | 424 | 387 | 380 | 375 | 407 | 413 | 415 | 409 | 394 | 374 |
| 2017 | 403 | 354 | 395 | 416 | 436 | 411 | 432 | 418 | 394 | 357 | 282 | 486 |
| 2018 | 442 | 315 | 298 | 330 | 380 | 398 | 461 | 458 | 465 | 454 | 490 | 435 |
| 2019 | 287 | 414 | 319 | 427 | 372 | 382 | 428 | 427 | 378 | 308 | 422 | 414 |
| 2020 | 408 | 255 | 323 | 286 | 319 | 379 | 403 | 409 | 388 | 368 | 388 | 363 |
| 2021 | 409 | 307 | 408 | 415 | 462 | 400 | 420 | 402 | 444 | 435 | 465 | 444 |
| 2022 | 394 | 363 | 353 | 347 | 369 | 414 | 411 | 368 | 354 | 295 | 266 | 374 |
| 2023 | 264 | 258 | 369 | 364 | 336 | 335 | 382 | 336 | 324 | 297 | 350 | 308 |
| 2024 | 297 | |||||||||||
| - = No Data Reported; -- = Not Applicable; NA = Not Available; W = Withheld to avoid disclosure of individual company data. |
| Release Date: 3/29/2024 |
| Next Release Date: 4/30/2024 |
Referring Pages: