|
Download Data (XLS File) |
|
||||||||
|
||||||||
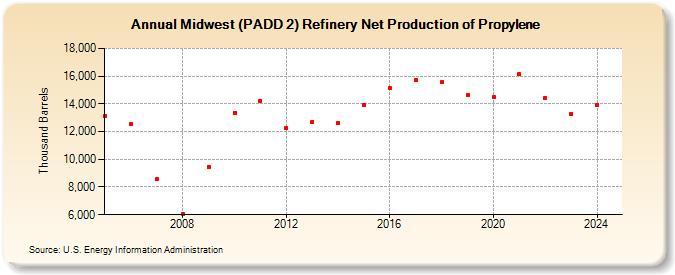
| Midwest (PADD 2) Refinery Net Production of Propylene (Thousand Barrels) | ||||||||
| Decade | Year-0 | Year-1 | Year-2 | Year-3 | Year-4 | Year-5 | Year-6 | Year-7 | Year-8 | Year-9 |
|---|---|---|---|---|---|---|---|---|---|---|
| 2000's | 13,097 | 12,541 | 8,549 | 6,046 | 9,477 | |||||
| 2010's | 13,369 | 14,238 | 12,290 | 12,714 | 12,651 | 13,950 | 15,160 | 15,737 | 15,544 | 14,638 |
| 2020's | 14,490 | 16,135 | 14,437 | 13,294 |
| - = No Data Reported; -- = Not Applicable; NA = Not Available; W = Withheld to avoid disclosure of individual company data. |
| Release Date: 3/29/2024 |
| Next Release Date: 8/30/2024 |
Referring Pages: