|
Download Data (XLS File) |
|
||||||||
|
||||||||
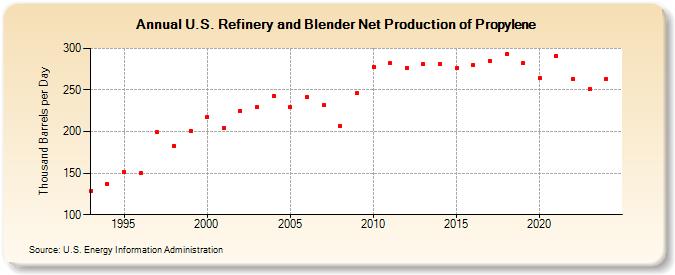
| U.S. Refinery and Blender Net Production of Propylene (Thousand Barrels per Day) | ||||||||
| Decade | Year-0 | Year-1 | Year-2 | Year-3 | Year-4 | Year-5 | Year-6 | Year-7 | Year-8 | Year-9 |
|---|---|---|---|---|---|---|---|---|---|---|
| 1990's | 129 | 137 | 151 | 150 | 199 | 183 | 201 | |||
| 2000's | 217 | 204 | 225 | 229 | 243 | 229 | 241 | 232 | 207 | 246 |
| 2010's | 278 | 282 | 277 | 281 | 281 | 276 | 280 | 285 | 293 | 282 |
| 2020's | 264 | 291 | 263 | 251 |
| - = No Data Reported; -- = Not Applicable; NA = Not Available; W = Withheld to avoid disclosure of individual company data. |
| Release Date: 8/30/2024 |
| Next Release Date: 8/29/2025 |