|
Download Data (XLS File) |
|
||||||||
|
||||||||
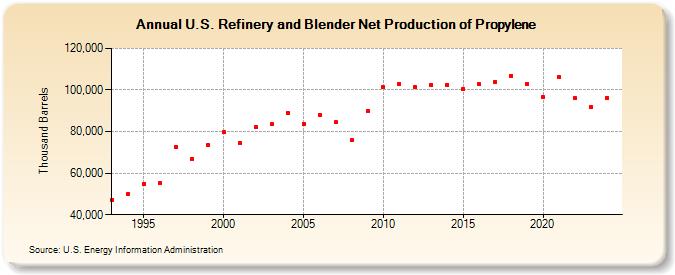
| U.S. Refinery and Blender Net Production of Propylene (Thousand Barrels) | ||||||||
| Decade | Year-0 | Year-1 | Year-2 | Year-3 | Year-4 | Year-5 | Year-6 | Year-7 | Year-8 | Year-9 |
|---|---|---|---|---|---|---|---|---|---|---|
| 1990's | 47,192 | 50,082 | 54,994 | 55,074 | 72,537 | 66,875 | 73,455 | |||
| 2000's | 79,548 | 74,605 | 82,101 | 83,433 | 89,080 | 83,652 | 88,080 | 84,583 | 75,752 | 89,834 |
| 2010's | 101,310 | 102,984 | 101,376 | 102,470 | 102,565 | 100,646 | 102,652 | 103,962 | 106,886 | 103,004 |
| 2020's | 96,517 | 106,125 | 96,111 | 91,605 |
| - = No Data Reported; -- = Not Applicable; NA = Not Available; W = Withheld to avoid disclosure of individual company data. |
| Release Date: 3/29/2024 |
| Next Release Date: 8/30/2024 |