|
Download Data (XLS File) |
|
||||||||
|
||||||||
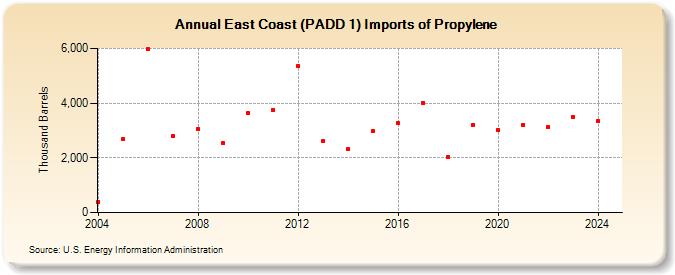
| East Coast (PADD 1) Imports of Propylene (Thousand Barrels) | ||||||||
| Decade | Year-0 | Year-1 | Year-2 | Year-3 | Year-4 | Year-5 | Year-6 | Year-7 | Year-8 | Year-9 |
|---|---|---|---|---|---|---|---|---|---|---|
| 2000's | 375 | 2,700 | 5,963 | 2,781 | 3,054 | 2,540 | ||||
| 2010's | 3,647 | 3,760 | 5,365 | 2,615 | 2,310 | 2,988 | 3,263 | 4,016 | 2,043 | 3,204 |
| 2020's | 3,015 | 3,217 | 3,118 | 3,495 |
| - = No Data Reported; -- = Not Applicable; NA = Not Available; W = Withheld to avoid disclosure of individual company data. |
| Release Date: 8/30/2024 |
| Next Release Date: 8/29/2025 |