|
Download Data (XLS File) |
|
||||||||
|
||||||||
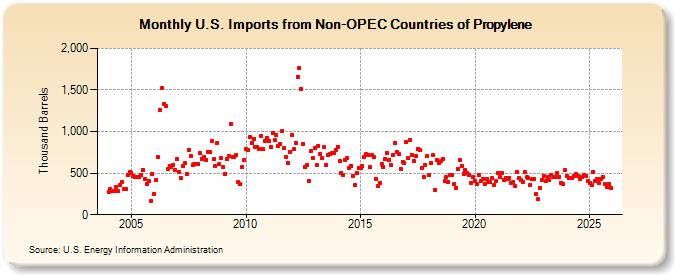
| U.S. Imports from Non-OPEC Countries of Propylene (Thousand Barrels) | ||||||||
| Year | Jan | Feb | Mar | Apr | May | Jun | Jul | Aug | Sep | Oct | Nov | Dec |
|---|---|---|---|---|---|---|---|---|---|---|---|---|
| 2004 | 274 | 305 | 285 | 287 | 331 | 280 | 360 | 396 | 314 | 309 | 476 | 514 |
| 2005 | 499 | 469 | 456 | 449 | 451 | 483 | 541 | 431 | 369 | 402 | 166 | 491 |
| 2006 | 248 | 419 | 688 | 1,263 | 1,520 | 1,330 | 1,302 | 545 | 589 | 578 | 597 | 535 |
| 2007 | 675 | 514 | 441 | 585 | 619 | 485 | 780 | 702 | 593 | 613 | 607 | 607 |
| 2008 | 738 | 674 | 690 | 657 | 753 | 759 | 889 | 666 | 589 | 859 | 604 | 677 |
| 2009 | 569 | 491 | 673 | 707 | 1,096 | 688 | 696 | 720 | 388 | 365 | 568 | 654 |
| 2010 | 786 | 783 | 939 | 863 | 914 | 817 | 815 | 785 | 950 | 787 | 885 | 924 |
| 2011 | 891 | 813 | 981 | 902 | 956 | 827 | 856 | 1,012 | 803 | 692 | 618 | 759 |
| 2012 | 957 | 796 | 866 | 1,661 | 1,768 | 1,513 | 854 | 579 | 595 | 400 | 762 | 677 |
| 2013 | 800 | 597 | 831 | 728 | 680 | 811 | 595 | 722 | 728 | 743 | 746 | 776 |
| 2014 | 816 | 641 | 503 | 478 | 662 | 680 | 564 | 587 | 464 | 357 | 503 | 564 |
| 2015 | 561 | 588 | 699 | 731 | 714 | 569 | 714 | 699 | 433 | 344 | 383 | 608 |
| 2016 | 575 | 671 | 748 | 662 | 602 | 716 | 858 | 753 | 734 | 552 | 637 | 622 |
| 2017 | 874 | 678 | 902 | 716 | 641 | 704 | 795 | 777 | 562 | 456 | 603 | 701 |
| 2018 | 473 | 623 | 715 | 302 | 658 | 617 | 645 | 665 | 407 | 451 | 394 | 476 |
| 2019 | 480 | 367 | 323 | 554 | 656 | 589 | 493 | 534 | 506 | 479 | 382 | 459 |
| 2020 | 401 | 374 | 476 | 405 | 427 | 366 | 434 | 397 | 395 | 441 | 353 | 406 |
| 2021 | 500 | 448 | 496 | 420 | 444 | 424 | 439 | 385 | 388 | 340 | 518 | 441 |
| 2022 | 414 | 391 | 519 | 448 | 437 | 358 | 428 | 431 | 252 | 189 | 323 | 421 |
| 2023 | 489 | 407 | 448 | 413 | 483 | 452 | 450 | 506 | 457 | 386 | 373 | 533 |
| 2024 | 354 | |||||||||||
| - = No Data Reported; -- = Not Applicable; NA = Not Available; W = Withheld to avoid disclosure of individual company data. |
| Release Date: 3/29/2024 |
| Next Release Date: 4/30/2024 |