|
Download Data (XLS File) |
|
||||||||
|
||||||||
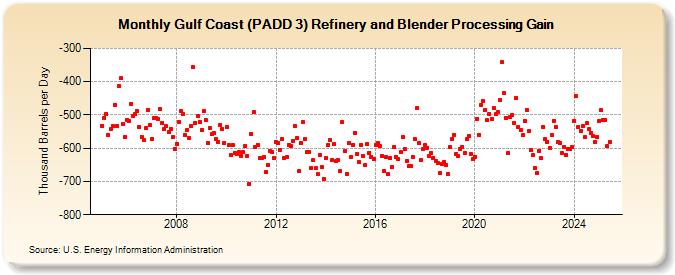
| Gulf Coast (PADD 3) Refinery and Blender Processing Gain (Thousand Barrels per Day) | ||||||||
| Year | Jan | Feb | Mar | Apr | May | Jun | Jul | Aug | Sep | Oct | Nov | Dec |
|---|---|---|---|---|---|---|---|---|---|---|---|---|
| 2005 | -532 | -509 | -497 | -560 | -543 | -534 | -469 | -533 | -412 | -390 | -526 | -567 |
| 2006 | -514 | -519 | -466 | -504 | -497 | -489 | -536 | -566 | -574 | -540 | -484 | -531 |
| 2007 | -573 | -510 | -508 | -513 | -481 | -524 | -542 | -534 | -552 | -543 | -567 | -603 |
| 2008 | -586 | -520 | -489 | -497 | -561 | -544 | -568 | -532 | -357 | -523 | -503 | -520 |
| 2009 | -544 | -489 | -514 | -584 | -539 | -558 | -554 | -573 | -580 | -529 | -542 | -583 |
| 2010 | -536 | -591 | -621 | -591 | -614 | -618 | -612 | -623 | -612 | -594 | -623 | -707 |
| 2011 | -557 | -492 | -596 | -589 | -631 | -629 | -627 | -672 | -651 | -608 | -612 | -631 |
| 2012 | -581 | -584 | -605 | -573 | -629 | -628 | -590 | -592 | -578 | -534 | -570 | -669 |
| 2013 | -583 | -522 | -572 | -610 | -610 | -659 | -637 | -661 | -679 | -621 | -658 | -692 |
| 2014 | -629 | -589 | -574 | -635 | -586 | -640 | -637 | -670 | -521 | -607 | -678 | -585 |
| 2015 | -627 | -589 | -553 | -617 | -642 | -589 | -623 | -652 | -588 | -613 | -625 | -634 |
| 2016 | -591 | -585 | -594 | -623 | -670 | -627 | -679 | -631 | -658 | -596 | -626 | -633 |
| 2017 | -612 | -567 | -603 | -638 | -654 | -654 | -625 | -573 | -480 | -584 | -637 | -601 |
| 2018 | -589 | -598 | -622 | -614 | -629 | -639 | -646 | -675 | -647 | -643 | -650 | -677 |
| 2019 | -596 | -572 | -559 | -616 | -623 | -601 | -596 | -615 | -573 | -563 | -617 | -634 |
| 2020 | -625 | -511 | -559 | -469 | -458 | -485 | -516 | -497 | -511 | -479 | -498 | -492 |
| 2021 | -454 | -342 | -433 | -508 | -615 | -507 | -500 | -524 | -449 | -536 | -545 | -561 |
| 2022 | -518 | -484 | -548 | -606 | -620 | -660 | -674 | -607 | -630 | -536 | -572 | -580 |
| 2023 | -600 | -557 | -509 | -540 | -591 | -607 | -644 | -601 | -621 | -605 | -606 | -591 |
| 2024 | -527 | -451 | -521 | -555 | ||||||||
| - = No Data Reported; -- = Not Applicable; NA = Not Available; W = Withheld to avoid disclosure of individual company data. |
| Release Date: 6/28/2024 |
| Next Release Date: 7/31/2024 |