|
Download Data (XLS File) |
|
||||||||
|
||||||||
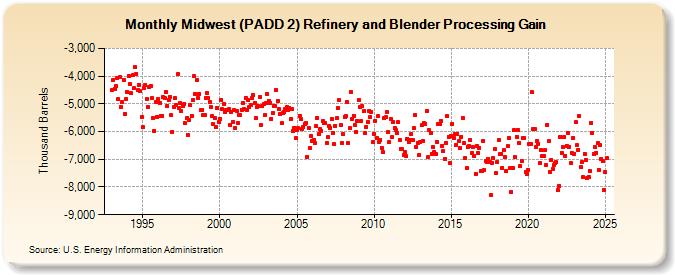
| Midwest (PADD 2) Refinery and Blender Processing Gain (Thousand Barrels) | ||||||||
| Year | Jan | Feb | Mar | Apr | May | Jun | Jul | Aug | Sep | Oct | Nov | Dec |
|---|---|---|---|---|---|---|---|---|---|---|---|---|
| 1993 | -4,493 | -4,140 | -4,451 | -4,353 | -4,063 | -4,842 | -4,042 | -5,113 | -4,931 | -4,125 | -5,360 | -4,825 |
| 1994 | -4,588 | -3,994 | -4,275 | -4,625 | -3,972 | -4,439 | -3,680 | -3,912 | -4,502 | -4,308 | -4,555 | -5,462 |
| 1995 | -5,845 | -4,416 | -4,320 | -4,829 | -5,100 | -4,390 | -4,349 | -4,803 | -5,501 | -5,965 | -4,937 | -5,464 |
| 1996 | -4,842 | -4,959 | -5,441 | -5,424 | -4,770 | -4,791 | -4,559 | -5,076 | -4,859 | -4,737 | -5,417 | -6,014 |
| 1997 | -5,128 | -4,799 | -5,049 | -3,934 | -5,144 | -4,987 | -5,257 | -5,063 | -5,008 | -5,692 | -5,523 | -6,114 |
| 1998 | -5,590 | -5,057 | -5,430 | -4,858 | -4,010 | -4,643 | -4,132 | -4,775 | -4,654 | -5,231 | -5,228 | -5,389 |
| 1999 | -5,410 | -4,773 | -4,607 | -4,807 | -4,930 | -5,120 | -5,443 | -5,740 | -5,516 | -5,839 | -5,138 | -5,659 |
| 2000 | -5,534 | -4,849 | -5,199 | -5,001 | -5,288 | -5,232 | -5,209 | -5,194 | -5,771 | -5,282 | -5,647 | -5,238 |
| 2001 | -5,859 | -5,252 | -5,699 | -5,417 | -5,414 | -5,209 | -4,956 | -5,203 | -4,775 | -5,223 | -4,879 | -5,104 |
| 2002 | -5,054 | -4,785 | -4,689 | -4,961 | -5,514 | -5,126 | -5,086 | -4,744 | -5,775 | -5,079 | -5,018 | -5,404 |
| 2003 | -4,985 | -4,652 | -4,891 | -4,959 | -5,544 | -5,329 | -5,068 | -5,071 | -4,507 | -4,888 | -5,196 | -5,372 |
| 2004 | -5,708 | -5,347 | -5,292 | -5,183 | -5,115 | -5,220 | -5,143 | -5,550 | -5,179 | -5,981 | -5,859 | -6,233 |
| 2005 | -5,936 | -5,888 | -5,438 | -5,564 | -5,890 | -5,852 | -5,739 | -5,674 | -6,905 | -5,876 | -6,592 | -6,153 |
| 2006 | -6,330 | -6,303 | -6,407 | -5,808 | -5,520 | -6,079 | -5,908 | -5,966 | -5,631 | -5,679 | -5,683 | -6,405 |
| 2007 | -6,207 | -5,790 | -5,859 | -5,548 | -6,048 | -6,460 | -5,790 | -5,511 | -5,154 | -4,878 | -5,775 | -6,420 |
| 2008 | -6,095 | -5,474 | -5,453 | -4,941 | -6,424 | -5,883 | -4,578 | -5,530 | -5,428 | -5,764 | -6,017 | -5,624 |
| 2009 | -4,858 | -5,132 | -5,620 | -5,089 | -5,271 | -6,066 | -5,825 | -5,647 | -5,255 | -5,470 | -5,296 | -6,391 |
| 2010 | -6,075 | -5,606 | -6,235 | -5,451 | -6,375 | -6,308 | -6,583 | -6,750 | -5,524 | -5,477 | -5,291 | -6,019 |
| 2011 | -6,380 | -5,547 | -6,207 | -5,649 | -5,860 | -5,951 | -6,051 | -5,668 | -6,301 | -6,613 | -6,639 | -6,850 |
| 2012 | -6,751 | -6,894 | -6,255 | -6,390 | -6,305 | -6,101 | -6,318 | -5,884 | -5,411 | -6,566 | -6,400 | -6,843 |
| 2013 | -6,384 | -5,781 | -6,350 | -5,700 | -5,712 | -5,267 | -6,930 | -5,959 | -6,065 | -6,793 | -6,568 | -6,731 |
| 2014 | -6,813 | -6,381 | -5,713 | -5,716 | -5,606 | -6,505 | -6,711 | -6,978 | -6,401 | -5,446 | -6,181 | -7,138 |
| 2015 | -6,145 | -5,725 | -6,226 | -6,074 | -6,483 | -6,078 | -6,342 | -6,605 | -6,182 | -5,498 | -6,414 | -6,960 |
| 2016 | -7,322 | -6,551 | -6,532 | -6,312 | -6,791 | -6,558 | -6,873 | -7,526 | -6,507 | -6,758 | -6,593 | -7,435 |
| 2017 | -7,441 | -6,335 | -7,394 | -7,051 | -7,096 | -6,977 | -7,116 | -8,271 | -7,121 | -6,959 | -6,631 | -7,507 |
| 2018 | -7,104 | -6,302 | -6,820 | -6,793 | -7,302 | -6,677 | -6,920 | -7,428 | -6,531 | -6,237 | -7,325 | -8,177 |
| 2019 | -7,315 | -5,945 | -6,933 | -6,182 | -5,939 | -6,408 | -7,246 | -7,076 | -6,215 | -6,234 | -7,451 | -7,528 |
| 2020 | -7,384 | -6,441 | -6,435 | -4,581 | -5,905 | -5,910 | -6,544 | -6,343 | -6,431 | -7,133 | -6,657 | -6,897 |
| 2021 | -6,874 | -6,666 | -7,193 | -5,747 | -6,354 | -7,446 | -7,032 | -7,344 | -7,211 | -7,148 | -7,112 | -8,123 |
| 2022 | -7,963 | -6,182 | -6,763 | -6,553 | -6,192 | -6,880 | -6,512 | -6,051 | -6,547 | -7,128 | -6,766 | -6,223 |
| 2023 | -6,792 | -5,660 | -6,497 | -6,648 | -5,443 | -7,285 | -7,099 | -7,654 | -6,797 | -7,014 | -7,688 | -7,622 |
| 2024 | -7,414 | -5,674 | -6,035 | -6,807 | -6,559 | -6,761 | -6,418 | -7,385 | -6,497 | -6,983 | -7,077 | -8,099 |
| 2025 | -7,457 | -6,959 | -7,058 | -6,546 | ||||||||
| - = No Data Reported; -- = Not Applicable; NA = Not Available; W = Withheld to avoid disclosure of individual company data. |
| Release Date: 6/30/2025 |
| Next Release Date: 7/31/2025 |