|
Download Data (XLS File) |
|
||||||||
|
||||||||
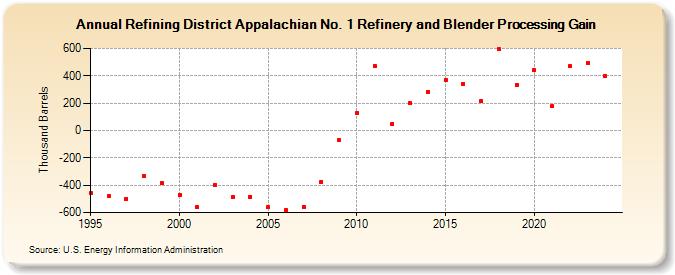
| Refining District Appalachian No. 1 Refinery and Blender Processing Gain (Thousand Barrels) | ||||||||
| Decade | Year-0 | Year-1 | Year-2 | Year-3 | Year-4 | Year-5 | Year-6 | Year-7 | Year-8 | Year-9 |
|---|---|---|---|---|---|---|---|---|---|---|
| 1990's | -458 | -481 | -498 | -333 | -384 | |||||
| 2000's | -473 | -563 | -395 | -488 | -483 | -560 | -583 | -556 | -373 | -72 |
| 2010's | 129 | 471 | 50 | 198 | 282 | 369 | 342 | 212 | 592 | 336 |
| 2020's | 439 | 178 | 469 | 496 |
| - = No Data Reported; -- = Not Applicable; NA = Not Available; W = Withheld to avoid disclosure of individual company data. |
| Release Date: 8/30/2024 |
| Next Release Date: 8/29/2025 |