|
Download Data (XLS File) |
|
||||||||
|
||||||||
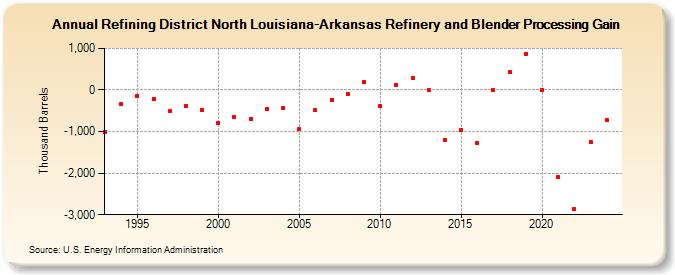
| Refining District North Louisiana-Arkansas Refinery and Blender Processing Gain (Thousand Barrels) | ||||||||
| Decade | Year-0 | Year-1 | Year-2 | Year-3 | Year-4 | Year-5 | Year-6 | Year-7 | Year-8 | Year-9 |
|---|---|---|---|---|---|---|---|---|---|---|
| 1990's | -1,004 | -339 | -134 | -213 | -514 | -383 | -480 | |||
| 2000's | -791 | -658 | -697 | -454 | -428 | -941 | -490 | -230 | -85 | 203 |
| 2010's | -390 | 120 | 286 | -4 | -1,208 | -951 | -1,280 | -6 | 438 | 868 |
| 2020's | 10 | -2,087 | -2,865 | -1,118 |
| - = No Data Reported; -- = Not Applicable; NA = Not Available; W = Withheld to avoid disclosure of individual company data. |
| Release Date: 3/29/2024 |
| Next Release Date: 8/30/2024 |