|
Download Data (XLS File) |
|
||||||||
|
||||||||
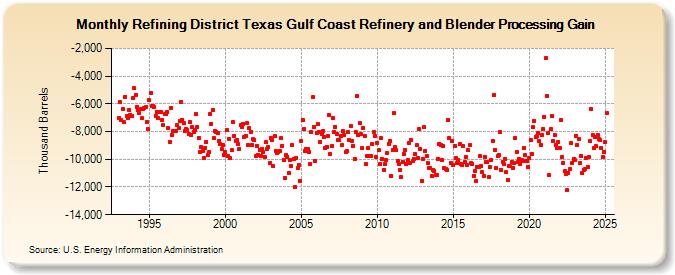
| Refining District Texas Gulf Coast Refinery and Blender Processing Gain (Thousand Barrels) | ||||||||
| Year | Jan | Feb | Mar | Apr | May | Jun | Jul | Aug | Sep | Oct | Nov | Dec |
|---|---|---|---|---|---|---|---|---|---|---|---|---|
| 1993 | -7,035 | -5,868 | -7,176 | -6,372 | -7,336 | -5,476 | -6,870 | -7,023 | -6,464 | -6,773 | -6,890 | -5,544 |
| 1994 | -4,877 | -5,396 | -6,207 | -6,462 | -6,685 | -6,381 | -7,049 | -6,404 | -6,285 | -6,238 | -7,279 | -7,824 |
| 1995 | -5,758 | -5,198 | -6,177 | -6,139 | -6,235 | -6,860 | -6,582 | -7,031 | -6,618 | -6,615 | -7,137 | -7,521 |
| 1996 | -6,734 | -6,728 | -6,570 | -7,739 | -8,719 | -6,319 | -8,273 | -7,990 | -7,940 | -7,971 | -7,562 | -7,768 |
| 1997 | -7,240 | -5,850 | -7,143 | -7,388 | -7,994 | -7,798 | -7,909 | -8,144 | -7,342 | -8,271 | -7,706 | -8,003 |
| 1998 | -7,921 | -6,737 | -7,669 | -8,453 | -9,486 | -9,130 | -9,404 | -9,874 | -9,179 | -8,734 | -9,660 | -9,510 |
| 1999 | -6,760 | -7,427 | -6,437 | -8,490 | -7,972 | -8,023 | -8,125 | -8,653 | -8,907 | -9,278 | -8,966 | -9,688 |
| 2000 | -9,478 | -7,877 | -9,762 | -8,508 | -9,928 | -9,347 | -7,335 | -8,309 | -8,672 | -8,636 | -8,899 | -9,269 |
| 2001 | -7,553 | -7,644 | -7,432 | -8,390 | -8,309 | -7,408 | -8,998 | -7,739 | -7,999 | -8,988 | -8,522 | -8,604 |
| 2002 | -9,787 | -9,023 | -9,668 | -9,297 | -9,765 | -9,273 | -9,504 | -9,800 | -8,787 | -9,291 | -9,137 | -10,278 |
| 2003 | -8,466 | -8,607 | -10,505 | -8,342 | -9,425 | -9,542 | -9,444 | -9,417 | -8,497 | -9,023 | -10,048 | -11,357 |
| 2004 | -9,663 | -9,815 | -11,020 | -10,040 | -10,515 | -8,989 | -9,979 | -11,969 | -9,921 | -10,605 | -10,399 | -11,549 |
| 2005 | -8,702 | -7,180 | -7,831 | -9,429 | -9,254 | -9,250 | -9,453 | -10,367 | -8,047 | -5,521 | -7,671 | -10,117 |
| 2006 | -8,090 | -7,479 | -8,021 | -8,750 | -8,154 | -7,955 | -8,384 | -9,154 | -9,082 | -8,323 | -6,837 | -9,653 |
| 2007 | -9,043 | -7,039 | -8,045 | -7,668 | -8,147 | -8,605 | -8,606 | -8,332 | -8,992 | -7,957 | -8,240 | -9,459 |
| 2008 | -9,410 | -8,057 | -8,620 | -7,583 | -8,655 | -9,041 | -9,965 | -8,056 | -5,463 | -8,256 | -7,383 | -8,209 |
| 2009 | -9,203 | -7,713 | -8,311 | -10,368 | -9,796 | -9,202 | -9,773 | -9,766 | -8,909 | -8,036 | -8,355 | -9,834 |
| 2010 | -8,800 | -9,348 | -10,362 | -8,481 | -9,953 | -10,738 | -10,363 | -10,062 | -9,547 | -8,884 | -8,656 | -11,176 |
| 2011 | -9,333 | -6,655 | -9,127 | -9,358 | -10,097 | -10,317 | -10,755 | -11,297 | -10,165 | -9,605 | -9,303 | -10,360 |
| 2012 | -10,073 | -8,814 | -10,241 | -8,637 | -10,149 | -9,964 | -9,647 | -9,004 | -9,935 | -7,784 | -9,250 | -11,578 |
| 2013 | -9,945 | -7,693 | -9,384 | -9,761 | -10,268 | -10,605 | -10,649 | -11,229 | -10,759 | -10,874 | -11,160 | -11,125 |
| 2014 | -9,976 | -8,881 | -8,938 | -10,046 | -9,032 | -10,663 | -10,673 | -10,758 | -7,141 | -8,482 | -10,256 | -8,693 |
| 2015 | -10,419 | -9,019 | -9,914 | -10,291 | -10,047 | -8,921 | -10,348 | -10,446 | -9,045 | -10,213 | -9,824 | -10,380 |
| 2016 | -9,356 | -8,960 | -10,269 | -10,325 | -11,183 | -10,855 | -11,555 | -10,573 | -10,582 | -9,762 | -10,515 | -10,948 |
| 2017 | -11,223 | -9,823 | -10,172 | -10,213 | -11,299 | -10,579 | -10,063 | -8,678 | -5,341 | -9,304 | -10,642 | -9,761 |
| 2018 | -9,666 | -8,057 | -10,757 | -10,202 | -10,352 | -9,965 | -10,945 | -11,493 | -10,473 | -10,506 | -10,211 | -10,617 |
| 2019 | -10,293 | -8,442 | -9,473 | -10,204 | -9,957 | -10,315 | -10,046 | -10,138 | -9,217 | -9,721 | -10,090 | -10,583 |
| 2020 | -9,873 | -8,604 | -9,620 | -7,658 | -7,236 | -8,377 | -8,356 | -8,082 | -8,705 | -8,965 | -8,279 | -7,827 |
| 2021 | -6,945 | -2,717 | -5,428 | -8,099 | -11,153 | -7,840 | -6,891 | -8,661 | -8,259 | -8,951 | -9,187 | -8,718 |
| 2022 | -9,197 | -7,180 | -9,870 | -10,234 | -10,854 | -11,039 | -12,213 | -10,964 | -10,735 | -8,821 | -10,268 | -9,953 |
| 2023 | -10,088 | -8,056 | -8,757 | -8,673 | -10,413 | -9,942 | -11,081 | -10,853 | -10,793 | -10,020 | -10,667 | -9,721 |
| 2024 | -8,702 | -6,376 | -8,264 | -9,186 | ||||||||
| - = No Data Reported; -- = Not Applicable; NA = Not Available; W = Withheld to avoid disclosure of individual company data. |
| Release Date: 6/28/2024 |
| Next Release Date: 7/31/2024 |