|
Download Data (XLS File) |
|
||||||||
|
||||||||
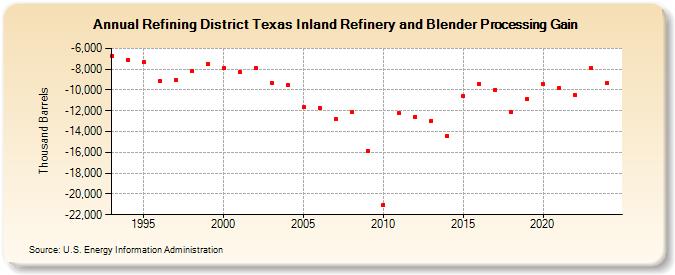
| Refining District Texas Inland Refinery and Blender Processing Gain (Thousand Barrels) | ||||||||
| Decade | Year-0 | Year-1 | Year-2 | Year-3 | Year-4 | Year-5 | Year-6 | Year-7 | Year-8 | Year-9 |
|---|---|---|---|---|---|---|---|---|---|---|
| 1990's | -6,685 | -7,131 | -7,333 | -9,158 | -9,056 | -8,187 | -7,521 | |||
| 2000's | -7,905 | -8,266 | -7,881 | -9,326 | -9,555 | -11,680 | -11,743 | -12,832 | -12,160 | -15,841 |
| 2010's | -21,028 | -12,257 | -12,559 | -12,954 | -14,406 | -10,626 | -9,389 | -9,958 | -12,155 | -10,890 |
| 2020's | -9,453 | -9,805 | -10,466 | -7,865 |
| - = No Data Reported; -- = Not Applicable; NA = Not Available; W = Withheld to avoid disclosure of individual company data. |
| Release Date: 8/30/2024 |
| Next Release Date: 8/29/2025 |