|
Download Data (XLS File) |
|
||||||||
|
||||||||
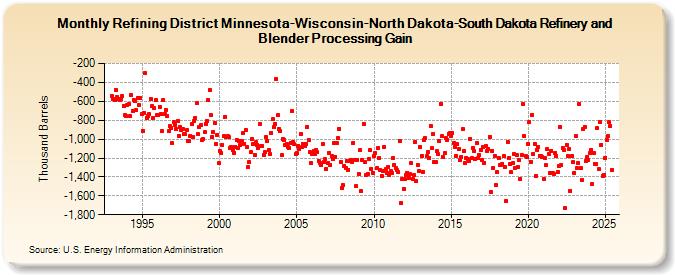
| Refining District Minnesota-Wisconsin-North Dakota-South Dakota Refinery and Blender Processing Gain (Thousand Barrels) | ||||||||
| Year | Jan | Feb | Mar | Apr | May | Jun | Jul | Aug | Sep | Oct | Nov | Dec |
|---|---|---|---|---|---|---|---|---|---|---|---|---|
| 1993 | -548 | -574 | -584 | -477 | -557 | -571 | -586 | -576 | -544 | -647 | -747 | -758 |
| 1994 | -634 | -627 | -756 | -531 | -699 | -582 | -599 | -697 | -563 | -643 | -565 | -736 |
| 1995 | -913 | -725 | -305 | -778 | -760 | -739 | -575 | -654 | -776 | -672 | -584 | -750 |
| 1996 | -749 | -657 | -730 | -919 | -584 | -733 | -694 | -758 | -919 | -859 | -882 | -1,044 |
| 1997 | -817 | -849 | -889 | -811 | -962 | -868 | -906 | -891 | -941 | -951 | -904 | -1,019 |
| 1998 | -1,024 | -971 | -842 | -978 | -808 | -776 | -621 | -951 | -874 | -855 | -1,008 | -999 |
| 1999 | -928 | -836 | -808 | -586 | -481 | -750 | -974 | -924 | -827 | -1,051 | -953 | -1,256 |
| 2000 | -1,125 | -1,148 | -1,061 | -972 | -766 | -977 | -970 | -983 | -1,089 | -1,079 | -1,112 | -1,145 |
| 2001 | -1,080 | -1,008 | -1,090 | -1,016 | -1,060 | -1,020 | -934 | -1,048 | -902 | -1,085 | -1,297 | -1,243 |
| 2002 | -1,140 | -998 | -1,052 | -1,171 | -1,035 | -1,059 | -1,094 | -843 | -1,075 | -1,072 | -1,165 | -1,137 |
| 2003 | -982 | -1,019 | -1,113 | -1,162 | -934 | -791 | -873 | -836 | -369 | -749 | -893 | -911 |
| 2004 | -1,173 | -994 | -1,010 | -1,059 | -1,054 | -1,084 | -1,090 | -1,040 | -707 | -1,029 | -1,055 | -1,158 |
| 2005 | -1,151 | -1,069 | -1,107 | -941 | -1,082 | -1,050 | -1,070 | -1,047 | -868 | -1,008 | -1,140 | -1,257 |
| 2006 | -1,155 | -1,125 | -1,154 | -1,113 | -1,141 | -1,228 | -1,258 | -1,275 | -1,057 | -1,241 | -1,214 | -1,316 |
| 2007 | -1,257 | -1,143 | -1,271 | -1,175 | -1,214 | -1,037 | -1,185 | -1,046 | -992 | -888 | -1,240 | -1,516 |
| 2008 | -1,490 | -1,281 | -1,302 | -1,229 | -1,323 | -1,229 | -1,220 | -1,239 | -1,038 | -1,222 | -1,498 | -1,216 |
| 2009 | -1,365 | -1,117 | -1,552 | -1,223 | -837 | -1,246 | -1,378 | -1,368 | -1,214 | -1,120 | -1,314 | -1,355 |
| 2010 | -1,178 | -1,148 | -1,310 | -1,092 | -1,201 | -1,325 | -1,390 | -1,340 | -1,080 | -1,321 | -1,357 | -1,299 |
| 2011 | -1,381 | -1,337 | -1,354 | -1,202 | -1,272 | -1,309 | -1,332 | -1,352 | -1,019 | -1,680 | -1,419 | -1,524 |
| 2012 | -1,427 | -1,380 | -1,354 | -1,411 | -1,373 | -1,255 | -1,423 | -1,381 | -1,026 | -1,443 | -1,276 | -1,335 |
| 2013 | -1,080 | -1,177 | -1,345 | -1,008 | -991 | -1,180 | -1,138 | -1,197 | -859 | -1,099 | -944 | -1,240 |
| 2014 | -1,245 | -1,131 | -1,162 | -1,023 | -624 | -971 | -1,191 | -1,151 | -986 | -1,006 | -946 | -940 |
| 2015 | -964 | -935 | -1,041 | -1,082 | -1,175 | -1,057 | -1,106 | -1,221 | -1,192 | -898 | -1,126 | -1,249 |
| 2016 | -1,198 | -1,206 | -1,234 | -994 | -1,204 | -1,094 | -1,127 | -1,206 | -1,039 | -1,205 | -1,173 | -1,113 |
| 2017 | -1,220 | -1,081 | -1,249 | -1,078 | -1,122 | -1,102 | -975 | -1,560 | -1,121 | -1,303 | -1,177 | -1,488 |
| 2018 | -1,352 | -1,198 | -1,277 | -1,271 | -1,262 | -1,181 | -1,293 | -1,654 | -1,028 | -1,201 | -1,265 | -1,352 |
| 2019 | -1,257 | -1,158 | -1,301 | -1,171 | -1,291 | -1,222 | -1,421 | -1,169 | -627 | -969 | -1,177 | -1,186 |
| 2020 | -1,047 | -820 | -1,238 | -744 | -1,153 | -1,050 | -1,388 | -1,112 | -1,080 | -1,175 | -1,184 | -1,187 |
| 2021 | -1,420 | -1,195 | -1,279 | -1,109 | -1,158 | -1,362 | -1,123 | -1,363 | -1,364 | -1,142 | -1,180 | -1,344 |
| 2022 | -1,287 | -871 | -1,279 | -1,095 | -1,113 | -1,734 | -1,058 | -1,184 | -1,100 | -1,546 | -1,179 | -1,246 |
| 2023 | -1,355 | -968 | -1,309 | -1,220 | -611 | -1,275 | -1,494 | -896 | -867 | -1,234 | -1,189 | -1,219 |
| 2024 | -1,147 | |||||||||||
| - = No Data Reported; -- = Not Applicable; NA = Not Available; W = Withheld to avoid disclosure of individual company data. |
| Release Date: 3/29/2024 |
| Next Release Date: 4/30/2024 |