|
Download Data (XLS File) |
|
||||||||
|
||||||||
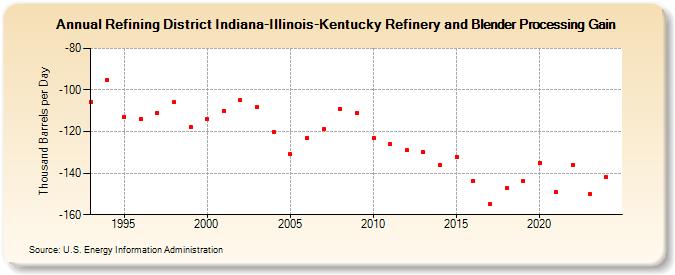
| Refining District Indiana-Illinois-Kentucky Refinery and Blender Processing Gain (Thousand Barrels per Day) | ||||||||
| Decade | Year-0 | Year-1 | Year-2 | Year-3 | Year-4 | Year-5 | Year-6 | Year-7 | Year-8 | Year-9 |
|---|---|---|---|---|---|---|---|---|---|---|
| 1990's | -106 | -95 | -113 | -114 | -111 | -106 | -118 | |||
| 2000's | -114 | -110 | -105 | -108 | -120 | -131 | -123 | -119 | -109 | -111 |
| 2010's | -123 | -126 | -129 | -130 | -136 | -132 | -144 | -155 | -147 | -144 |
| 2020's | -135 | -149 | -136 | -151 |
| - = No Data Reported; -- = Not Applicable; NA = Not Available; W = Withheld to avoid disclosure of individual company data. |
| Release Date: 3/29/2024 |
| Next Release Date: 8/30/2024 |