|
Download Data (XLS File) |
|
||||||||
|
||||||||
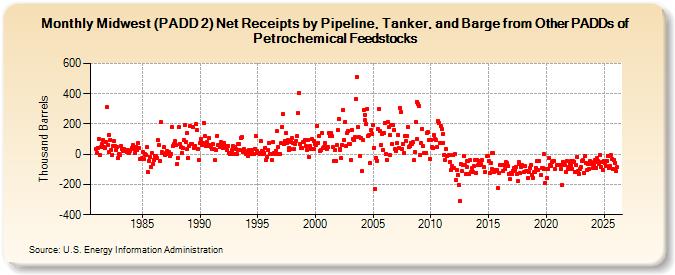
| Midwest (PADD 2) Net Receipts by Pipeline, Tanker, and Barge from Other PADDs of Petrochemical Feedstocks (Thousand Barrels) | ||||||||
| Year | Jan | Feb | Mar | Apr | May | Jun | Jul | Aug | Sep | Oct | Nov | Dec |
|---|---|---|---|---|---|---|---|---|---|---|---|---|
| 1981 | 34 | 10 | 43 | 101 | -4 | 47 | 67 | 92 | 47 | 42 | 80 | 310 |
| 1982 | 61 | 126 | 13 | 97 | 28 | -4 | 53 | 87 | 55 | 27 | 47 | -24 |
| 1983 | 2 | -8 | 54 | 34 | 21 | 37 | 25 | 23 | 13 | 26 | 9 | 21 |
| 1984 | 40 | 58 | 33 | 5 | 36 | 51 | 25 | 73 | 40 | -33 | -31 | |
| 1985 | -28 | 13 | -34 | 0 | -5 | 45 | -120 | -43 | -16 | -83 | 6 | -64 |
| 1986 | -36 | -9 | -10 | -24 | 91 | 62 | -44 | 211 | 15 | 6 | 5 | 46 |
| 1987 | -3 | -1 | 22 | 3 | 14 | -13 | 4 | 177 | 54 | 70 | 87 | 62 |
| 1988 | -67 | -25 | 178 | 68 | 46 | 8 | 42 | 94 | 192 | 78 | 141 | 32 |
| 1989 | -22 | 57 | 185 | 68 | 70 | 179 | 40 | 57 | 198 | 160 | 34 | -38 |
| 1990 | 72 | 99 | 58 | 75 | 206 | 118 | 55 | 80 | 55 | 104 | 58 | 49 |
| 1991 | 35 | 68 | 36 | 33 | -41 | 29 | 123 | 58 | 62 | 51 | 78 | 52 |
| 1992 | 42 | 73 | 45 | 55 | 29 | 57 | 7 | 0 | 0 | 26 | 54 | 0 |
| 1993 | 47 | 37 | 0 | 66 | 25 | 68 | 26 | 106 | 115 | 16 | 33 | 19 |
| 1994 | 0 | 9 | -12 | 27 | 23 | 0 | 31 | 0 | 0 | 33 | 118 | 18 |
| 1995 | 10 | 10 | 0 | 86 | 20 | 0 | 17 | 7 | 44 | -38 | -21 | 29 |
| 1996 | 76 | 0 | 0 | -40 | 82 | 9 | 0 | 24 | 151 | 48 | 0 | 0 |
| 1997 | 73 | 177 | 263 | 70 | 88 | 139 | 74 | 95 | 26 | 41 | 34 | 80 |
| 1998 | 106 | 75 | 36 | 66 | 87 | 118 | 274 | 403 | 68 | 44 | 43 | 79 |
| 1999 | 81 | 94 | 54 | 31 | 94 | -17 | 54 | 33 | 102 | 35 | 33 | 88 |
| 2000 | 68 | 63 | 189 | 76 | 118 | 23 | 31 | 140 | 39 | 45 | 71 | 51 |
| 2001 | 33 | 46 | 141 | 120 | 138 | 123 | 46 | -47 | 29 | -47 | 60 | 160 |
| 2002 | 236 | 31 | 35 | -24 | 61 | 295 | 94 | 216 | 52 | 142 | 153 | 70 |
| 2003 | 68 | -35 | 163 | 98 | 91 | 114 | 366 | 511 | 177 | 115 | -10 | 104 |
| 2004 | -112 | 96 | 293 | 262 | 224 | 197 | 301 | 121 | 129 | -58 | 161 | 131 |
| 2005 | 192 | 41 | -228 | -22 | -42 | 167 | 300 | 152 | 62 | 135 | 27 | 141 |
| 2006 | 209 | 1 | -35 | 214 | 178 | -8 | 125 | 191 | 66 | 191 | 159 | 33 |
| 2007 | 18 | 77 | 130 | 43 | 308 | 278 | 34 | 69 | 11 | 121 | 88 | 121 |
| 2008 | 179 | 49 | 55 | 77 | 69 | 79 | -40 | 12 | 212 | 346 | 99 | 335 |
| 2009 | 318 | -5 | 72 | 170 | 53 | 6 | 8 | 9 | 143 | 148 | 94 | -31 |
| 2010 | 96 | 45 | 38 | 127 | 101 | 94 | 46 | 220 | 205 | 74 | 185 | 165 |
| 2011 | 133 | 77 | -2 | -38 | 34 | -12 | -2 | -49 | -107 | -75 | -5 | |
| 2012 | -93 | 0 | -171 | -104 | -137 | -202 | -312 | -66 | -113 | -71 | -14 | -74 |
| 2013 | -132 | -83 | -42 | -42 | -130 | -41 | -115 | -90 | -120 | -81 | -40 | -122 |
| 2014 | -41 | -72 | -42 | -70 | -66 | -40 | -85 | -120 | -13 | -13 | ||
| 2015 | -45 | -122 | -58 | -97 | 10 | 6 | -118 | -106 | -108 | -106 | -222 | -126 |
| 2016 | -73 | -70 | -74 | -113 | -71 | -101 | -54 | -61 | -79 | -129 | -167 | -124 |
| 2017 | -134 | -108 | -94 | -106 | -85 | -131 | -179 | -53 | -62 | -126 | -84 | -74 |
| 2018 | -79 | -117 | -81 | -113 | -112 | -157 | -116 | -94 | -69 | -136 | -156 | -119 |
| 2019 | -120 | -92 | -46 | -102 | -43 | -140 | -94 | -91 | -97 | -1 | -192 | |
| 2020 | -97 | -160 | -96 | -23 | -73 | -77 | -51 | -45 | -45 | -100 | -72 | |
| 2021 | -69 | -72 | -72 | -97 | -204 | -51 | -72 | -74 | -115 | -45 | -97 | -83 |
| 2022 | -64 | -74 | -42 | -97 | -48 | -49 | -117 | -71 | -19 | -113 | -129 | -99 |
| 2023 | -85 | -47 | -40 | -121 | -14 | -56 | -105 | -67 | -100 | -45 | -50 | -67 |
| 2024 | -90 | |||||||||||
| - = No Data Reported; -- = Not Applicable; NA = Not Available; W = Withheld to avoid disclosure of individual company data. |
| Release Date: 3/29/2024 |
| Next Release Date: 4/30/2024 |