|
Download Data (XLS File) |
|
||||||||
|
||||||||
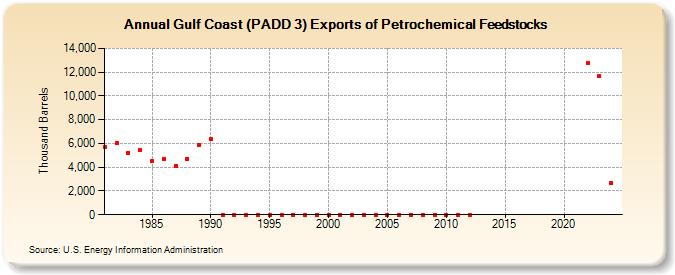
| Gulf Coast (PADD 3) Exports of Petrochemical Feedstocks (Thousand Barrels) | ||||||||
| Decade | Year-0 | Year-1 | Year-2 | Year-3 | Year-4 | Year-5 | Year-6 | Year-7 | Year-8 | Year-9 |
|---|---|---|---|---|---|---|---|---|---|---|
| 1980's | 5,692 | 6,014 | 5,216 | 5,408 | 4,502 | 4,692 | 4,101 | 4,729 | 5,880 | |
| 1990's | 6,335 | 0 | 0 | 0 | 0 | 0 | 0 | 0 | 0 | 0 |
| 2000's | 0 | 0 | 0 | 0 | 0 | 0 | 0 | 0 | 0 | 0 |
| 2010's | 0 | 0 | 0 | |||||||
| 2020's | 12,795 | 9,708 |
| - = No Data Reported; -- = Not Applicable; NA = Not Available; W = Withheld to avoid disclosure of individual company data. |
| Release Date: 3/29/2024 |
| Next Release Date: 8/30/2024 |