|
Download Data (XLS File) |
|
||||||||
|
||||||||
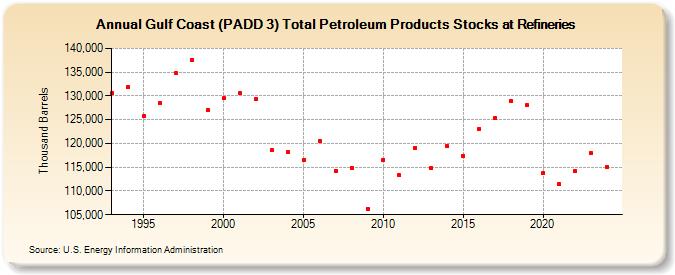
| Gulf Coast (PADD 3) Total Petroleum Products Stocks at Refineries (Thousand Barrels) | ||||||||
| Decade | Year-0 | Year-1 | Year-2 | Year-3 | Year-4 | Year-5 | Year-6 | Year-7 | Year-8 | Year-9 |
|---|---|---|---|---|---|---|---|---|---|---|
| 1990's | 130,513 | 131,800 | 125,713 | 128,447 | 134,821 | 137,642 | 127,018 | |||
| 2000's | 129,461 | 130,523 | 129,265 | 118,552 | 118,097 | 116,545 | 120,596 | 114,271 | 114,931 | 106,269 |
| 2010's | 116,583 | 113,266 | 119,079 | 114,830 | 119,433 | 117,329 | 123,092 | 125,300 | 128,868 | 128,032 |
| 2020's | 113,752 | 111,418 | 114,116 | 117,908 |
| - = No Data Reported; -- = Not Applicable; NA = Not Available; W = Withheld to avoid disclosure of individual company data. |
| Release Date: 3/29/2024 |
| Next Release Date: 8/30/2024 |