|
Download Data (XLS File) |
|
||||||||
|
||||||||
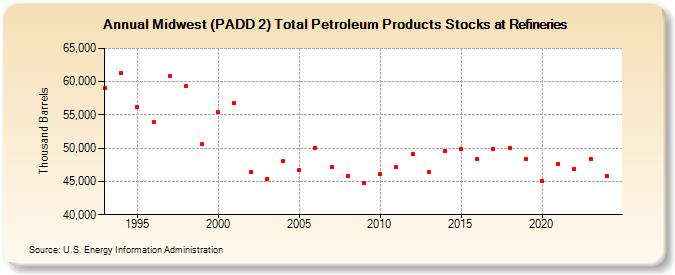
| Midwest (PADD 2) Total Petroleum Products Stocks at Refineries (Thousand Barrels) | ||||||||
| Decade | Year-0 | Year-1 | Year-2 | Year-3 | Year-4 | Year-5 | Year-6 | Year-7 | Year-8 | Year-9 |
|---|---|---|---|---|---|---|---|---|---|---|
| 1990's | 58,984 | 61,351 | 56,171 | 53,947 | 60,800 | 59,357 | 50,584 | |||
| 2000's | 55,370 | 56,746 | 46,400 | 45,382 | 48,077 | 46,683 | 50,052 | 47,231 | 45,852 | 44,719 |
| 2010's | 46,165 | 47,120 | 49,184 | 46,435 | 49,637 | 49,840 | 48,434 | 49,947 | 50,033 | 48,324 |
| 2020's | 45,117 | 47,590 | 46,883 | 48,518 |
| - = No Data Reported; -- = Not Applicable; NA = Not Available; W = Withheld to avoid disclosure of individual company data. |
| Release Date: 3/29/2024 |
| Next Release Date: 8/30/2024 |