|
Download Data (XLS File) |
|
||||||||
|
||||||||
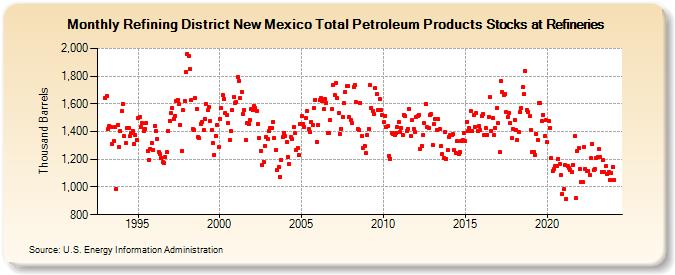
| Refining District New Mexico Total Petroleum Products Stocks at Refineries (Thousand Barrels) | ||||||||
| Year | Jan | Feb | Mar | Apr | May | Jun | Jul | Aug | Sep | Oct | Nov | Dec |
|---|---|---|---|---|---|---|---|---|---|---|---|---|
| 1993 | 1,643 | 1,653 | 1,415 | 1,441 | 1,436 | 1,311 | 1,329 | 1,434 | 986 | 1,446 | 1,291 | 1,405 |
| 1994 | 1,548 | 1,600 | 1,365 | 1,314 | 1,425 | 1,423 | 1,366 | 1,386 | 1,407 | 1,312 | 1,373 | 1,342 |
| 1995 | 1,495 | 1,508 | 1,436 | 1,463 | 1,406 | 1,422 | 1,460 | 1,259 | 1,198 | 1,276 | 1,318 | 1,270 |
| 1996 | 1,441 | 1,404 | 1,349 | 1,252 | 1,236 | 1,210 | 1,181 | 1,174 | 1,218 | 1,249 | 1,406 | 1,477 |
| 1997 | 1,532 | 1,573 | 1,492 | 1,512 | 1,620 | 1,631 | 1,598 | 1,450 | 1,260 | 1,553 | 1,623 | 1,832 |
| 1998 | 1,959 | 1,948 | 1,852 | 1,629 | 1,422 | 1,408 | 1,640 | 1,566 | 1,361 | 1,351 | 1,455 | 1,472 |
| 1999 | 1,411 | 1,494 | 1,602 | 1,553 | 1,576 | 1,475 | 1,410 | 1,316 | 1,234 | 1,369 | 1,450 | 1,286 |
| 2000 | 1,492 | 1,571 | 1,662 | 1,635 | 1,534 | 1,519 | 1,465 | 1,340 | 1,401 | 1,557 | 1,649 | 1,608 |
| 2001 | 1,611 | 1,792 | 1,766 | 1,641 | 1,688 | 1,524 | 1,559 | 1,337 | 1,462 | 1,457 | 1,485 | 1,564 |
| 2002 | 1,554 | 1,585 | 1,570 | 1,545 | 1,452 | 1,353 | 1,262 | 1,157 | 1,181 | 1,297 | 1,362 | 1,345 |
| 2003 | 1,402 | 1,425 | 1,427 | 1,471 | 1,352 | 1,267 | 1,124 | 1,145 | 1,074 | 1,198 | 1,359 | 1,391 |
| 2004 | 1,365 | 1,322 | 1,213 | 1,169 | 1,362 | 1,345 | 1,433 | 1,386 | 1,269 | 1,281 | 1,228 | 1,457 |
| 2005 | 1,510 | 1,454 | 1,436 | 1,501 | 1,545 | 1,419 | 1,394 | 1,469 | 1,446 | 1,571 | 1,630 | 1,324 |
| 2006 | 1,450 | 1,629 | 1,639 | 1,619 | 1,561 | 1,633 | 1,607 | 1,392 | 1,387 | 1,484 | 1,564 | 1,733 |
| 2007 | 1,665 | 1,750 | 1,640 | 1,535 | 1,385 | 1,421 | 1,508 | 1,603 | 1,686 | 1,727 | 1,731 | 1,504 |
| 2008 | 1,481 | 1,460 | 1,722 | 1,736 | 1,610 | 1,420 | 1,414 | 1,605 | 1,367 | 1,282 | 1,299 | 1,245 |
| 2009 | 1,373 | 1,422 | 1,734 | 1,573 | 1,551 | 1,527 | 1,713 | 1,671 | 1,558 | 1,638 | 1,558 | 1,519 |
| 2010 | 1,467 | 1,511 | 1,432 | 1,438 | 1,227 | 1,203 | 1,393 | 1,383 | 1,374 | 1,388 | 1,432 | 1,467 |
| 2011 | 1,396 | 1,429 | 1,374 | 1,521 | 1,512 | 1,405 | 1,421 | 1,562 | 1,369 | 1,484 | 1,421 | 1,398 |
| 2012 | 1,507 | 1,511 | 1,523 | 1,275 | 1,299 | 1,376 | 1,461 | 1,597 | 1,431 | 1,426 | 1,517 | 1,524 |
| 2013 | 1,302 | 1,452 | 1,492 | 1,409 | 1,488 | 1,420 | 1,294 | 1,235 | 1,206 | 1,396 | 1,202 | 1,265 |
| 2014 | 1,362 | 1,375 | 1,372 | 1,382 | 1,264 | 1,246 | 1,330 | 1,237 | 1,252 | 1,330 | 1,342 | 1,391 |
| 2015 | 1,331 | 1,472 | 1,404 | 1,424 | 1,546 | 1,406 | 1,518 | 1,435 | 1,534 | 1,402 | 1,439 | 1,411 |
| 2016 | 1,515 | 1,528 | 1,376 | 1,423 | 1,377 | 1,505 | 1,648 | 1,406 | 1,501 | 1,372 | 1,427 | 1,567 |
| 2017 | 1,459 | 1,249 | 1,763 | 1,687 | 1,662 | 1,671 | 1,542 | 1,505 | 1,537 | 1,462 | 1,353 | 1,417 |
| 2018 | 1,485 | 1,412 | 1,341 | 1,395 | 1,538 | 1,568 | 1,718 | 1,668 | 1,840 | 1,552 | 1,544 | 1,510 |
| 2019 | 1,408 | 1,252 | 1,251 | 1,232 | 1,384 | 1,341 | 1,605 | 1,607 | 1,475 | 1,522 | 1,366 | 1,481 |
| 2020 | 1,324 | 1,475 | 1,427 | 1,208 | 1,114 | 1,133 | 1,151 | 1,155 | 1,203 | 1,163 | 1,083 | 951 |
| 2021 | 984 | 1,157 | 916 | 1,148 | 1,138 | 1,121 | 1,106 | 1,161 | 1,366 | 920 | 1,258 | 1,279 |
| 2022 | 1,129 | 1,036 | 1,037 | 1,289 | 1,132 | 1,117 | 1,116 | 1,089 | 1,207 | 1,312 | 1,120 | 1,129 |
| 2023 | 1,211 | 1,217 | 1,271 | 1,216 | 1,110 | 1,194 | 1,106 | 1,151 | 1,097 | 1,106 | 1,054 | 1,101 |
| 2024 | 1,144 | |||||||||||
| - = No Data Reported; -- = Not Applicable; NA = Not Available; W = Withheld to avoid disclosure of individual company data. |
| Release Date: 3/29/2024 |
| Next Release Date: 4/30/2024 |
Referring Pages: