|
Download Data (XLS File) |
|
||||||||
|
||||||||
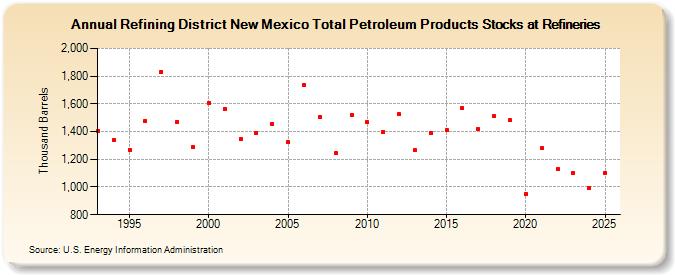
| Refining District New Mexico Total Petroleum Products Stocks at Refineries (Thousand Barrels) | ||||||||
| Decade | Year-0 | Year-1 | Year-2 | Year-3 | Year-4 | Year-5 | Year-6 | Year-7 | Year-8 | Year-9 |
|---|---|---|---|---|---|---|---|---|---|---|
| 1990's | 1,405 | 1,342 | 1,270 | 1,477 | 1,832 | 1,472 | 1,286 | |||
| 2000's | 1,608 | 1,564 | 1,345 | 1,391 | 1,457 | 1,324 | 1,733 | 1,504 | 1,245 | 1,519 |
| 2010's | 1,467 | 1,398 | 1,524 | 1,265 | 1,391 | 1,411 | 1,567 | 1,417 | 1,510 | 1,481 |
| 2020's | 951 | 1,279 | 1,129 | 1,101 |
| - = No Data Reported; -- = Not Applicable; NA = Not Available; W = Withheld to avoid disclosure of individual company data. |
| Release Date: 8/30/2024 |
| Next Release Date: 8/29/2025 |
Referring Pages: