|
Download Data (XLS File) |
|
||||||||
|
||||||||
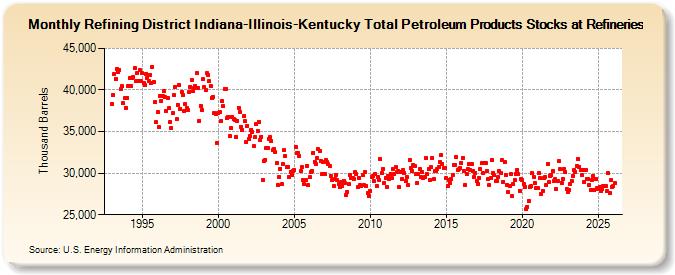
| Refining District Indiana-Illinois-Kentucky Total Petroleum Products Stocks at Refineries (Thousand Barrels) | ||||||||
| Year | Jan | Feb | Mar | Apr | May | Jun | Jul | Aug | Sep | Oct | Nov | Dec |
|---|---|---|---|---|---|---|---|---|---|---|---|---|
| 1993 | 38,318 | 39,449 | 41,917 | 41,372 | 42,552 | 42,214 | 42,448 | 40,068 | 40,440 | 38,377 | 38,991 | 37,879 |
| 1994 | 39,092 | 40,482 | 41,459 | 40,508 | 41,456 | 41,580 | 42,617 | 41,021 | 42,013 | 41,068 | 42,395 | 41,068 |
| 1995 | 41,994 | 40,816 | 40,575 | 41,951 | 41,413 | 41,034 | 41,839 | 40,838 | 42,767 | 41,008 | 38,536 | 36,094 |
| 1996 | 37,327 | 35,518 | 39,302 | 38,731 | 39,264 | 39,820 | 39,143 | 37,493 | 39,010 | 37,806 | 36,170 | 35,429 |
| 1997 | 37,222 | 39,357 | 40,401 | 36,482 | 38,248 | 40,572 | 37,765 | 39,723 | 39,451 | 37,495 | 38,340 | 37,830 |
| 1998 | 37,545 | 39,794 | 40,413 | 41,163 | 39,867 | 40,250 | 40,498 | 41,990 | 40,251 | 36,321 | 38,101 | 37,585 |
| 1999 | 41,270 | 40,335 | 40,056 | 41,999 | 41,840 | 41,025 | 40,486 | 39,051 | 39,163 | 37,247 | 37,108 | 33,675 |
| 2000 | 37,241 | 37,338 | 36,212 | 38,671 | 38,048 | 40,137 | 40,119 | 36,611 | 36,805 | 34,473 | 35,416 | 36,768 |
| 2001 | 36,479 | 36,377 | 34,371 | 36,311 | 37,868 | 37,320 | 35,581 | 35,175 | 36,824 | 36,237 | 33,698 | 35,723 |
| 2002 | 34,090 | 34,503 | 35,207 | 34,973 | 33,212 | 34,296 | 35,880 | 35,074 | 36,176 | 33,942 | 34,380 | 29,156 |
| 2003 | 31,463 | 31,595 | 33,010 | 33,055 | 34,145 | 34,341 | 33,861 | 32,778 | 32,926 | 32,499 | 31,175 | 28,590 |
| 2004 | 29,560 | 30,540 | 28,644 | 31,082 | 32,747 | 32,061 | 30,775 | 30,780 | 29,579 | 30,156 | 29,718 | 30,306 |
| 2005 | 30,406 | 33,146 | 32,428 | 32,436 | 32,033 | 30,241 | 30,692 | 29,198 | 28,686 | 29,174 | 30,913 | 28,553 |
| 2006 | 29,516 | 30,157 | 30,310 | 32,461 | 31,367 | 31,121 | 31,792 | 32,852 | 32,616 | 31,480 | 29,866 | 31,371 |
| 2007 | 29,838 | 31,594 | 31,322 | 31,047 | 30,805 | 29,655 | 29,120 | 28,482 | 29,305 | 29,809 | 29,128 | 28,677 |
| 2008 | 28,390 | 28,945 | 28,438 | 29,101 | 28,804 | 27,387 | 27,746 | 28,667 | 29,832 | 29,374 | 29,421 | 29,295 |
| 2009 | 30,083 | 29,920 | 28,279 | 29,450 | 28,559 | 28,435 | 29,767 | 28,571 | 30,188 | 28,455 | 27,599 | 27,243 |
| 2010 | 27,853 | 29,587 | 29,606 | 29,037 | 29,876 | 28,481 | 29,573 | 29,133 | 31,694 | 29,977 | 30,504 | 28,848 |
| 2011 | 29,416 | 28,379 | 29,627 | 29,271 | 29,941 | 29,389 | 30,477 | 29,850 | 30,707 | 30,084 | 30,302 | 28,315 |
| 2012 | 30,165 | 29,310 | 30,356 | 30,026 | 29,056 | 29,487 | 28,551 | 31,582 | 30,593 | 30,241 | 30,991 | 30,832 |
| 2013 | 29,856 | 28,867 | 29,923 | 30,446 | 29,525 | 30,105 | 29,377 | 29,546 | 31,875 | 29,904 | 30,484 | 29,194 |
| 2014 | 30,704 | 31,831 | 29,286 | 30,231 | 30,227 | 30,532 | 30,730 | 31,345 | 32,180 | 31,158 | 30,616 | 30,563 |
| 2015 | 29,414 | 28,425 | 29,197 | 28,815 | 29,317 | 29,752 | 30,963 | 30,929 | 31,883 | 30,386 | 30,448 | 30,624 |
| 2016 | 31,253 | 31,876 | 30,310 | 28,587 | 29,946 | 30,505 | 31,116 | 30,399 | 31,147 | 30,251 | 29,549 | 30,046 |
| 2017 | 29,002 | 28,677 | 29,452 | 30,525 | 31,166 | 30,025 | 31,186 | 31,220 | 30,234 | 29,239 | 28,596 | 29,438 |
| 2018 | 31,582 | 30,062 | 29,726 | 29,049 | 29,112 | 29,475 | 30,201 | 30,060 | 31,525 | 28,988 | 31,293 | 29,831 |
| 2019 | 28,617 | 27,690 | 28,446 | 29,886 | 27,220 | 28,691 | 29,189 | 29,918 | 30,386 | 29,877 | 27,884 | 29,250 |
| 2020 | 29,132 | 28,747 | 28,290 | 25,640 | 25,980 | 26,654 | 28,324 | 28,397 | 29,966 | 29,548 | 28,795 | 28,213 |
| 2021 | 28,184 | 29,961 | 29,436 | 27,494 | 27,884 | 29,401 | 29,541 | 28,515 | 31,111 | 28,875 | 29,701 | 29,730 |
| 2022 | 30,283 | 29,094 | 29,269 | 28,094 | 29,061 | 31,444 | 30,454 | 28,851 | 29,322 | 30,494 | 30,116 | 28,126 |
| 2023 | 27,736 | 27,988 | 28,721 | 29,055 | 29,710 | 30,350 | 30,138 | 30,870 | 31,723 | 30,741 | 30,373 | 29,805 |
| 2024 | 30,379 | |||||||||||
| - = No Data Reported; -- = Not Applicable; NA = Not Available; W = Withheld to avoid disclosure of individual company data. |
| Release Date: 3/29/2024 |
| Next Release Date: 4/30/2024 |