|
Download Data (XLS File) |
|
||||||||
|
||||||||
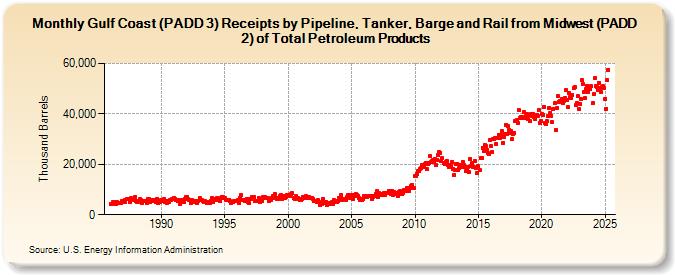
| Gulf Coast (PADD 3) Receipts by Pipeline, Tanker, Barge and Rail from Midwest (PADD 2) of Total Petroleum Products (Thousand Barrels) | ||||||||
| Year | Jan | Feb | Mar | Apr | May | Jun | Jul | Aug | Sep | Oct | Nov | Dec |
|---|---|---|---|---|---|---|---|---|---|---|---|---|
| 1986 | 4,308 | 4,391 | 4,901 | 4,648 | 5,157 | 4,154 | 4,944 | 4,831 | 4,653 | 4,768 | 4,812 | 5,378 |
| 1987 | 5,230 | 4,921 | 6,012 | 6,082 | 6,406 | 6,067 | 5,081 | 6,465 | 6,071 | 6,327 | 5,927 | 7,013 |
| 1988 | 5,394 | 4,904 | 5,200 | 5,563 | 6,103 | 5,698 | 4,556 | 5,281 | 5,354 | 5,408 | 4,508 | 6,094 |
| 1989 | 6,238 | 4,856 | 5,345 | 5,824 | 5,503 | 5,646 | 5,370 | 5,061 | 6,223 | 4,834 | 5,364 | 4,975 |
| 1990 | 5,971 | 5,511 | 6,080 | 5,186 | 5,273 | 4,528 | 5,424 | 4,952 | 6,006 | 5,748 | 6,139 | 6,215 |
| 1991 | 6,753 | 6,291 | 5,848 | 5,754 | 5,405 | 5,811 | 4,216 | 5,856 | 5,008 | 5,004 | 6,283 | 6,927 |
| 1992 | 7,139 | 6,125 | 5,813 | 5,958 | 4,797 | 5,647 | 5,530 | 5,181 | 5,630 | 4,910 | 4,605 | 5,494 |
| 1993 | 6,632 | 5,652 | 5,665 | 5,479 | 5,196 | 5,273 | 5,148 | 4,462 | 4,766 | 4,993 | 4,559 | 5,355 |
| 1994 | 6,536 | 5,180 | 6,339 | 6,004 | 5,891 | 6,596 | 6,364 | 5,604 | 6,541 | 7,218 | 7,015 | 6,446 |
| 1995 | 6,472 | 5,878 | 5,755 | 5,691 | 5,891 | 5,322 | 4,805 | 5,133 | 4,902 | 5,301 | 5,369 | 5,399 |
| 1996 | 5,751 | 4,755 | 6,778 | 7,665 | 5,836 | 5,871 | 5,753 | 5,436 | 5,730 | 6,429 | 5,217 | 4,671 |
| 1997 | 6,145 | 6,165 | 7,222 | 6,841 | 6,997 | 5,589 | 5,279 | 5,448 | 6,785 | 5,197 | 5,453 | 5,336 |
| 1998 | 6,928 | 6,490 | 6,855 | 6,631 | 6,814 | 6,435 | 5,341 | 5,952 | 5,912 | 6,559 | 7,392 | 8,392 |
| 1999 | 6,827 | 6,284 | 6,248 | 6,633 | 7,343 | 7,829 | 6,179 | 6,687 | 7,264 | 6,589 | 7,173 | 7,980 |
| 2000 | 7,776 | 7,799 | 7,303 | 8,133 | 8,421 | 6,443 | 6,358 | 7,350 | 6,439 | 6,558 | 6,259 | 5,803 |
| 2001 | 5,731 | 6,319 | 7,193 | 6,818 | 7,103 | 7,302 | 6,699 | 7,193 | 7,017 | 6,780 | 6,438 | 6,418 |
| 2002 | 5,278 | 5,254 | 5,566 | 5,134 | 5,908 | 5,175 | 4,010 | 4,741 | 4,275 | 6,163 | 4,805 | 4,660 |
| 2003 | 5,205 | 3,891 | 4,683 | 4,756 | 4,198 | 4,865 | 4,373 | 5,915 | 5,382 | 5,196 | 4,861 | 5,262 |
| 2004 | 6,645 | 6,752 | 7,638 | 5,907 | 6,065 | 6,296 | 6,299 | 5,983 | 6,912 | 7,984 | 6,689 | 7,644 |
| 2005 | 6,974 | 6,366 | 7,880 | 7,550 | 8,147 | 7,734 | 7,493 | 6,753 | 5,684 | 6,057 | 5,944 | 6,064 |
| 2006 | 7,309 | 7,576 | 6,886 | 7,153 | 7,518 | 7,322 | 7,261 | 6,407 | 7,152 | 7,447 | 7,507 | 8,348 |
| 2007 | 9,227 | 6,986 | 8,437 | 8,086 | 7,705 | 8,135 | 7,967 | 8,717 | 7,938 | 8,655 | 8,564 | 9,443 |
| 2008 | 9,575 | 8,102 | 9,436 | 7,985 | 9,047 | 8,377 | 8,455 | 8,421 | 7,360 | 8,988 | 9,384 | 8,326 |
| 2009 | 8,369 | 8,565 | 9,957 | 9,365 | 10,670 | 9,387 | 9,544 | 10,710 | 11,585 | 11,877 | 10,414 | 10,794 |
| 2010 | 15,227 | 15,293 | 16,097 | 17,435 | 17,366 | 18,300 | 18,653 | 19,803 | 19,005 | 19,991 | 20,628 | 18,134 |
| 2011 | 20,101 | 20,543 | 23,171 | 20,742 | 21,420 | 21,797 | 20,718 | 22,097 | 19,544 | 21,819 | 23,791 | 24,827 |
| 2012 | 24,682 | 21,454 | 22,389 | 20,386 | 20,179 | 20,910 | 21,474 | 19,758 | 18,971 | 19,636 | 19,244 | 21,091 |
| 2013 | 18,072 | 15,907 | 17,653 | 20,030 | 20,152 | 17,819 | 18,622 | 19,646 | 18,917 | 20,939 | 19,595 | 18,734 |
| 2014 | 17,435 | 17,730 | 19,110 | 16,996 | 22,005 | 19,291 | 20,362 | 18,881 | 18,768 | 21,195 | 18,714 | 16,645 |
| 2015 | 19,197 | 17,567 | 22,370 | 22,532 | 26,661 | 25,367 | 27,713 | 27,260 | 25,815 | 24,381 | 24,275 | 29,821 |
| 2016 | 27,125 | 25,049 | 30,130 | 30,112 | 30,472 | 28,019 | 30,471 | 31,800 | 30,506 | 31,787 | 33,072 | 28,610 |
| 2017 | 30,985 | 31,966 | 35,749 | 32,010 | 35,125 | 33,719 | 32,536 | 33,199 | 29,886 | 32,132 | 32,570 | 37,002 |
| 2018 | 37,487 | 36,274 | 41,550 | 38,511 | 38,855 | 38,763 | 38,202 | 40,673 | 38,212 | 39,013 | 39,879 | 37,937 |
| 2019 | 39,547 | 37,089 | 39,988 | 39,069 | 39,871 | 38,857 | 37,855 | 39,696 | 39,089 | 41,483 | 36,544 | 37,178 |
| 2020 | 39,958 | 39,719 | 42,859 | 36,504 | 36,108 | 37,041 | 39,079 | 42,265 | 40,509 | 39,139 | 36,609 | 42,138 |
| 2021 | 44,256 | 33,602 | 42,231 | 47,045 | 44,859 | 45,144 | 45,227 | 45,858 | 44,145 | 45,200 | 46,404 | 49,406 |
| 2022 | 45,657 | 42,568 | 48,324 | 46,871 | 46,293 | 47,555 | 50,236 | 50,668 | 43,422 | 44,241 | 46,986 | 41,814 |
| 2023 | 44,002 | 45,998 | 53,258 | 51,785 | 48,580 | 46,148 | 49,985 | 51,213 | 48,796 | 50,569 | 49,738 | 50,749 |
| 2024 | 43,757 | |||||||||||
| - = No Data Reported; -- = Not Applicable; NA = Not Available; W = Withheld to avoid disclosure of individual company data. |
| Release Date: 3/29/2024 |
| Next Release Date: 4/30/2024 |