|
Download Data (XLS File) |
|
||||||||
|
||||||||
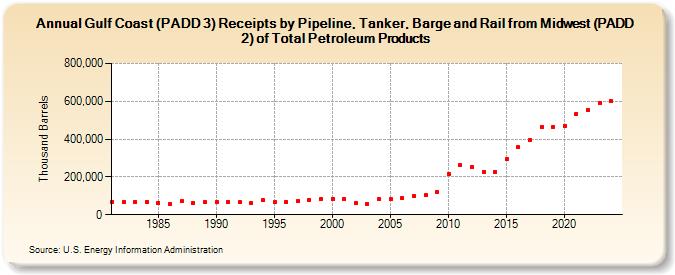
| Gulf Coast (PADD 3) Receipts by Pipeline, Tanker, Barge and Rail from Midwest (PADD 2) of Total Petroleum Products (Thousand Barrels) | ||||||||
| Decade | Year-0 | Year-1 | Year-2 | Year-3 | Year-4 | Year-5 | Year-6 | Year-7 | Year-8 | Year-9 |
|---|---|---|---|---|---|---|---|---|---|---|
| 1980's | 68,916 | 66,040 | 69,745 | 68,983 | 63,305 | 56,945 | 71,602 | 64,063 | 65,239 | |
| 1990's | 67,033 | 69,156 | 66,829 | 63,180 | 75,734 | 65,918 | 69,892 | 72,457 | 79,701 | 83,036 |
| 2000's | 84,642 | 81,011 | 60,969 | 58,587 | 80,814 | 82,646 | 87,886 | 99,860 | 103,456 | 121,237 |
| 2010's | 215,933 | 260,569 | 250,172 | 226,086 | 227,131 | 292,959 | 357,153 | 396,880 | 465,357 | 466,267 |
| 2020's | 471,926 | 533,377 | 554,634 | 590,822 |
| - = No Data Reported; -- = Not Applicable; NA = Not Available; W = Withheld to avoid disclosure of individual company data. |
| Release Date: 3/29/2024 |
| Next Release Date: 8/30/2024 |