|
Download Data (XLS File) |
|
||||||||
|
||||||||
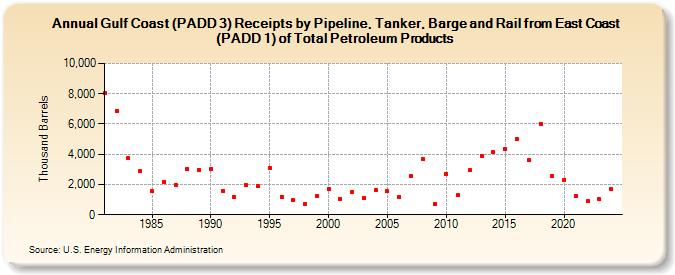
| Gulf Coast (PADD 3) Receipts by Pipeline, Tanker, Barge and Rail from East Coast (PADD 1) of Total Petroleum Products (Thousand Barrels) | ||||||||
| Decade | Year-0 | Year-1 | Year-2 | Year-3 | Year-4 | Year-5 | Year-6 | Year-7 | Year-8 | Year-9 |
|---|---|---|---|---|---|---|---|---|---|---|
| 1980's | 8,050 | 6,860 | 3,747 | 2,865 | 1,543 | 2,166 | 1,980 | 3,004 | 2,984 | |
| 1990's | 3,015 | 1,592 | 1,180 | 1,964 | 1,885 | 3,107 | 1,178 | 982 | 712 | 1,265 |
| 2000's | 1,730 | 1,055 | 1,518 | 1,106 | 1,630 | 1,546 | 1,179 | 2,540 | 3,652 | 729 |
| 2010's | 2,724 | 1,271 | 2,945 | 3,886 | 4,144 | 4,327 | 5,001 | 3,585 | 6,031 | 2,559 |
| 2020's | 2,313 | 1,233 | 877 | 1,019 |
| - = No Data Reported; -- = Not Applicable; NA = Not Available; W = Withheld to avoid disclosure of individual company data. |
| Release Date: 3/29/2024 |
| Next Release Date: 8/30/2024 |