|
Download Data (XLS File) |
|
||||||||
|
||||||||
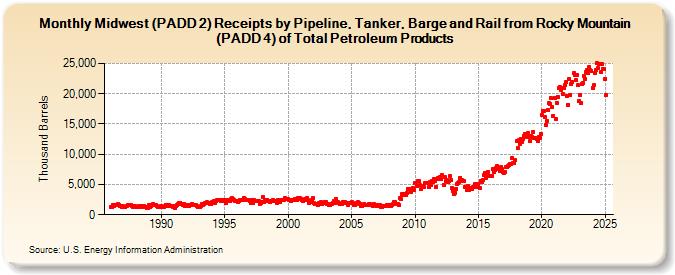
| Midwest (PADD 2) Receipts by Pipeline, Tanker, Barge and Rail from Rocky Mountain (PADD 4) of Total Petroleum Products (Thousand Barrels) | ||||||||
| Year | Jan | Feb | Mar | Apr | May | Jun | Jul | Aug | Sep | Oct | Nov | Dec |
|---|---|---|---|---|---|---|---|---|---|---|---|---|
| 1986 | 1,334 | 1,258 | 1,573 | 1,491 | 1,628 | 1,525 | 1,646 | 1,765 | 1,600 | 1,514 | 1,418 | 1,231 |
| 1987 | 1,364 | 1,339 | 1,322 | 1,391 | 1,612 | 1,548 | 1,571 | 1,594 | 1,436 | 1,332 | 1,424 | 1,375 |
| 1988 | 1,314 | 1,283 | 1,299 | 1,378 | 1,458 | 1,330 | 1,431 | 1,453 | 1,347 | 1,289 | 1,113 | 1,130 |
| 1989 | 1,539 | 1,270 | 1,434 | 1,534 | 1,741 | 1,539 | 1,620 | 1,595 | 1,469 | 1,321 | 1,277 | 1,299 |
| 1990 | 1,391 | 1,279 | 1,318 | 1,425 | 1,638 | 1,441 | 1,543 | 1,646 | 1,468 | 1,405 | 1,461 | 1,313 |
| 1991 | 1,438 | 1,139 | 1,474 | 1,648 | 1,720 | 1,954 | 1,956 | 1,850 | 1,613 | 1,702 | 1,374 | 1,477 |
| 1992 | 1,605 | 1,435 | 1,501 | 1,658 | 1,622 | 1,765 | 1,591 | 1,576 | 1,558 | 1,571 | 1,408 | 1,354 |
| 1993 | 1,353 | 1,376 | 1,758 | 1,587 | 1,829 | 1,926 | 2,017 | 2,058 | 2,004 | 1,998 | 1,788 | 1,704 |
| 1994 | 2,035 | 1,944 | 2,242 | 1,930 | 2,280 | 2,432 | 2,462 | 2,417 | 2,345 | 2,369 | 2,321 | 2,394 |
| 1995 | 2,383 | 1,879 | 2,439 | 2,417 | 2,482 | 2,334 | 2,516 | 2,683 | 2,545 | 2,413 | 2,306 | 2,315 |
| 1996 | 2,132 | 2,207 | 2,444 | 2,383 | 2,359 | 2,437 | 2,775 | 2,571 | 2,460 | 2,418 | 2,398 | 2,377 |
| 1997 | 2,200 | 1,980 | 2,366 | 1,915 | 2,376 | 2,340 | 2,288 | 2,340 | 2,234 | 1,727 | 1,957 | 2,032 |
| 1998 | 2,927 | 2,048 | 2,409 | 2,279 | 2,484 | 2,310 | 2,327 | 2,174 | 2,189 | 2,272 | 2,405 | 2,226 |
| 1999 | 2,258 | 1,953 | 2,420 | 2,131 | 2,105 | 2,474 | 2,459 | 2,418 | 2,396 | 2,682 | 2,624 | 2,596 |
| 2000 | 2,574 | 2,487 | 2,453 | 2,279 | 2,500 | 2,450 | 2,530 | 2,605 | 2,483 | 2,788 | 2,672 | 2,699 |
| 2001 | 2,533 | 2,372 | 2,343 | 2,433 | 2,520 | 2,399 | 2,809 | 2,392 | 2,002 | 2,054 | 2,400 | 2,702 |
| 2002 | 1,855 | 1,818 | 1,805 | 1,830 | 1,553 | 1,930 | 1,815 | 2,074 | 1,763 | 1,988 | 1,936 | 2,102 |
| 2003 | 2,065 | 1,746 | 1,738 | 1,597 | 1,604 | 1,838 | 1,928 | 2,207 | 1,903 | 2,600 | 2,079 | 2,025 |
| 2004 | 1,961 | 1,727 | 1,850 | 1,835 | 2,147 | 2,057 | 2,070 | 1,917 | 1,939 | 1,650 | 1,864 | 1,981 |
| 2005 | 2,027 | 1,899 | 1,603 | 1,604 | 1,705 | 2,011 | 2,094 | 1,912 | 1,741 | 1,414 | 1,438 | 1,559 |
| 2006 | 1,789 | 1,632 | 1,677 | 1,630 | 1,689 | 1,787 | 1,609 | 1,590 | 1,506 | 1,691 | 1,679 | 1,658 |
| 2007 | 1,480 | 1,429 | 1,591 | 1,583 | 1,344 | 1,264 | 1,466 | 1,473 | 1,474 | 1,524 | 1,628 | 1,508 |
| 2008 | 1,605 | 1,454 | 1,660 | 1,754 | 2,076 | 2,097 | 1,821 | 1,747 | 1,734 | 1,592 | 2,718 | 2,550 |
| 2009 | 3,492 | 3,336 | 3,437 | 3,322 | 3,572 | 4,239 | 4,232 | 4,273 | 3,836 | 4,054 | 4,429 | 4,131 |
| 2010 | 5,294 | 5,283 | 4,738 | 5,519 | 5,555 | 4,840 | 4,205 | 4,803 | 4,560 | 5,178 | 5,301 | 5,257 |
| 2011 | 5,204 | 4,613 | 5,342 | 4,988 | 5,616 | 5,425 | 5,877 | 5,631 | 4,660 | 5,929 | 6,029 | 5,872 |
| 2012 | 6,185 | 5,834 | 6,494 | 4,994 | 6,174 | 5,562 | 5,702 | 5,399 | 5,535 | 6,361 | 5,666 | 4,397 |
| 2013 | 3,880 | 3,401 | 3,643 | 4,314 | 5,078 | 5,265 | 5,382 | 6,116 | 5,819 | 5,639 | 5,495 | 4,647 |
| 2014 | 4,597 | 4,095 | 4,702 | 4,155 | 4,350 | 4,405 | 4,251 | 4,566 | 4,615 | 5,030 | 4,533 | 5,108 |
| 2015 | 4,955 | 4,474 | 5,560 | 5,419 | 5,791 | 6,513 | 6,885 | 6,146 | 6,357 | 7,072 | 6,414 | 6,318 |
| 2016 | 6,336 | 6,442 | 7,594 | 7,043 | 7,379 | 7,802 | 8,006 | 7,591 | 7,259 | 7,851 | 7,499 | 7,036 |
| 2017 | 6,896 | 7,120 | 7,905 | 7,855 | 8,053 | 8,210 | 8,424 | 8,347 | 9,450 | 8,599 | 8,510 | 8,972 |
| 2018 | 12,107 | 10,998 | 12,292 | 11,757 | 12,582 | 12,020 | 12,595 | 13,089 | 13,312 | 12,975 | 12,832 | 13,560 |
| 2019 | 12,876 | 12,146 | 13,001 | 12,859 | 13,705 | 12,716 | 12,761 | 12,489 | 12,206 | 12,867 | 12,715 | 13,353 |
| 2020 | 16,547 | 17,147 | 17,194 | 16,073 | 14,818 | 15,511 | 17,373 | 18,456 | 18,274 | 19,217 | 17,766 | 16,382 |
| 2021 | 19,333 | 15,831 | 18,517 | 19,492 | 20,880 | 21,152 | 20,671 | 20,867 | 19,957 | 21,008 | 21,363 | 21,887 |
| 2022 | 19,676 | 18,181 | 22,495 | 19,859 | 21,666 | 22,004 | 23,350 | 23,080 | 22,236 | 23,028 | 21,369 | 18,795 |
| 2023 | 19,807 | 18,457 | 21,636 | 21,819 | 22,998 | 22,480 | 23,565 | 23,982 | 23,350 | 24,413 | 23,875 | 23,790 |
| 2024 | 20,997 | |||||||||||
| - = No Data Reported; -- = Not Applicable; NA = Not Available; W = Withheld to avoid disclosure of individual company data. |
| Release Date: 3/29/2024 |
| Next Release Date: 4/30/2024 |