|
Download Data (XLS File) |
|
||||||||
|
||||||||
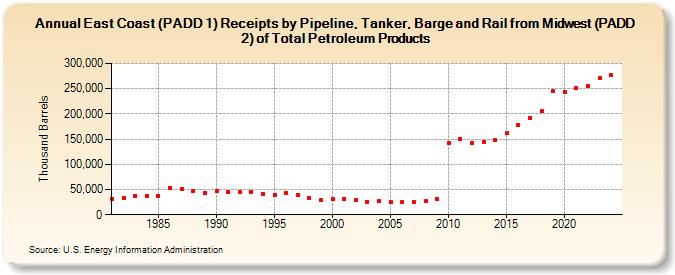
| East Coast (PADD 1) Receipts by Pipeline, Tanker, Barge and Rail from Midwest (PADD 2) of Total Petroleum Products (Thousand Barrels) | ||||||||
| Decade | Year-0 | Year-1 | Year-2 | Year-3 | Year-4 | Year-5 | Year-6 | Year-7 | Year-8 | Year-9 |
|---|---|---|---|---|---|---|---|---|---|---|
| 1980's | 31,192 | 33,507 | 37,082 | 36,837 | 37,830 | 52,742 | 51,782 | 47,727 | 42,408 | |
| 1990's | 47,337 | 45,402 | 45,626 | 45,240 | 40,682 | 40,076 | 43,115 | 40,029 | 32,244 | 28,583 |
| 2000's | 30,324 | 31,609 | 29,471 | 25,537 | 27,054 | 24,841 | 24,302 | 24,394 | 26,529 | 30,843 |
| 2010's | 141,907 | 149,333 | 142,239 | 144,086 | 147,635 | 161,166 | 178,581 | 192,543 | 204,901 | 245,477 |
| 2020's | 243,225 | 251,512 | 255,090 | 267,671 |
| - = No Data Reported; -- = Not Applicable; NA = Not Available; W = Withheld to avoid disclosure of individual company data. |
| Release Date: 3/29/2024 |
| Next Release Date: 8/30/2024 |