|
Download Data (XLS File) |
|
||||||||
|
||||||||
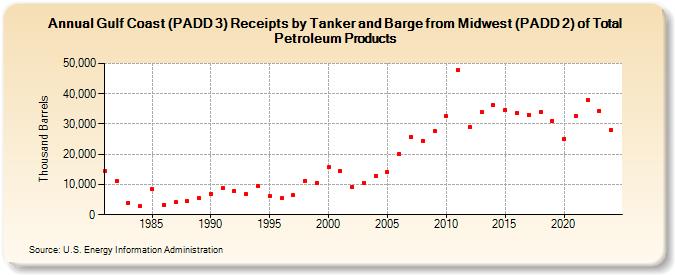
| Gulf Coast (PADD 3) Receipts by Tanker and Barge from Midwest (PADD 2) of Total Petroleum Products (Thousand Barrels) | ||||||||
| Decade | Year-0 | Year-1 | Year-2 | Year-3 | Year-4 | Year-5 | Year-6 | Year-7 | Year-8 | Year-9 |
|---|---|---|---|---|---|---|---|---|---|---|
| 1980's | 14,345 | 11,083 | 3,957 | 2,743 | 8,343 | 3,316 | 4,164 | 4,572 | 5,473 | |
| 1990's | 6,943 | 8,839 | 7,865 | 6,836 | 9,574 | 6,076 | 5,393 | 6,354 | 11,229 | 10,489 |
| 2000's | 15,687 | 14,494 | 9,250 | 10,597 | 12,808 | 14,118 | 20,127 | 25,812 | 24,470 | 27,722 |
| 2010's | 32,488 | 47,897 | 28,985 | 34,068 | 36,169 | 34,586 | 33,708 | 33,075 | 34,043 | 31,144 |
| 2020's | 25,188 | 32,587 | 38,075 | 34,296 |
| - = No Data Reported; -- = Not Applicable; NA = Not Available; W = Withheld to avoid disclosure of individual company data. |
| Release Date: 8/30/2024 |
| Next Release Date: 8/29/2025 |