|
Download Data (XLS File) |
|
||||||||
|
||||||||
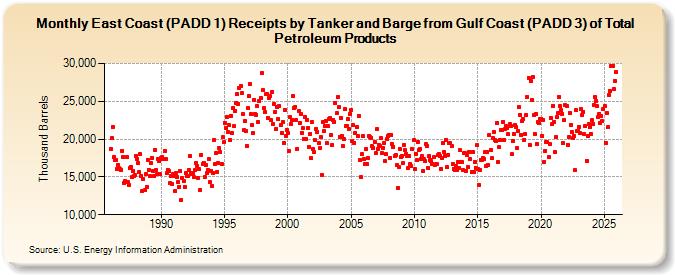
| East Coast (PADD 1) Receipts by Tanker and Barge from Gulf Coast (PADD 3) of Total Petroleum Products (Thousand Barrels) | ||||||||
| Year | Jan | Feb | Mar | Apr | May | Jun | Jul | Aug | Sep | Oct | Nov | Dec |
|---|---|---|---|---|---|---|---|---|---|---|---|---|
| 1986 | 18,746 | 20,096 | 21,623 | 17,597 | 17,174 | 17,207 | 16,038 | 16,611 | 16,135 | 16,090 | 15,903 | 18,491 |
| 1987 | 17,578 | 14,227 | 14,393 | 17,615 | 14,388 | 13,979 | 16,138 | 16,368 | 14,949 | 15,716 | 15,066 | 15,280 |
| 1988 | 17,797 | 17,386 | 16,860 | 15,589 | 17,970 | 15,142 | 13,160 | 14,753 | 13,214 | 15,345 | 13,699 | 17,292 |
| 1989 | 15,972 | 15,079 | 16,832 | 17,563 | 15,818 | 15,130 | 18,551 | 15,976 | 15,374 | 17,415 | 17,130 | 15,332 |
| 1990 | 17,463 | 17,689 | 17,376 | 18,388 | 17,370 | 15,516 | 15,927 | 15,758 | 14,169 | 15,178 | 14,067 | 15,420 |
| 1991 | 15,167 | 13,143 | 15,485 | 14,998 | 14,313 | 13,705 | 15,728 | 11,974 | 14,836 | 14,457 | 13,686 | 15,504 |
| 1992 | 15,070 | 15,176 | 15,969 | 17,742 | 15,543 | 15,434 | 15,526 | 14,934 | 15,865 | 16,793 | 16,410 | 14,891 |
| 1993 | 16,006 | 13,301 | 17,926 | 16,715 | 16,883 | 14,928 | 16,556 | 15,455 | 15,957 | 17,319 | 14,320 | 15,841 |
| 1994 | 13,823 | 15,499 | 19,903 | 16,769 | 18,204 | 15,660 | 16,810 | 18,779 | 18,258 | 16,682 | 20,223 | 19,580 |
| 1995 | 22,149 | 21,444 | 22,907 | 20,878 | 21,838 | 19,929 | 23,046 | 20,865 | 24,139 | 21,676 | 23,767 | 24,791 |
| 1996 | 25,919 | 24,642 | 26,725 | 26,994 | 26,037 | 23,316 | 21,155 | 22,407 | 21,012 | 19,087 | 24,055 | 25,683 |
| 1997 | 27,233 | 23,323 | 21,836 | 20,791 | 25,202 | 23,374 | 23,237 | 24,316 | 22,248 | 25,023 | 25,375 | 28,684 |
| 1998 | 26,454 | 24,111 | 23,538 | 25,917 | 25,936 | 22,854 | 25,462 | 25,646 | 22,479 | 26,232 | 22,014 | 24,704 |
| 1999 | 23,633 | 21,364 | 24,259 | 22,631 | 24,392 | 21,811 | 20,775 | 22,277 | 19,504 | 23,851 | 20,421 | 21,203 |
| 2000 | 20,821 | 18,414 | 22,872 | 21,970 | 22,554 | 25,654 | 24,140 | 24,305 | 22,557 | 18,716 | 23,765 | 22,101 |
| 2001 | 23,339 | 20,863 | 21,417 | 20,055 | 22,898 | 20,043 | 22,532 | 21,511 | 18,999 | 20,716 | 17,499 | 22,266 |
| 2002 | 18,676 | 18,239 | 19,839 | 21,328 | 20,979 | 19,431 | 18,805 | 20,277 | 15,257 | 22,248 | 21,038 | 21,752 |
| 2003 | 22,403 | 19,443 | 21,718 | 22,612 | 22,829 | 20,538 | 19,190 | 22,564 | 22,280 | 24,723 | 23,405 | 25,597 |
| 2004 | 24,256 | 20,316 | 22,848 | 20,451 | 19,081 | 19,960 | 23,959 | 21,774 | 21,784 | 22,635 | 21,337 | 23,284 |
| 2005 | 23,895 | 19,683 | 21,826 | 19,536 | 20,844 | 21,599 | 20,376 | 23,120 | 17,181 | 14,931 | 17,966 | 20,367 |
| 2006 | 17,382 | 16,678 | 18,662 | 16,643 | 17,564 | 20,448 | 20,295 | 20,146 | 19,037 | 18,797 | 19,652 | 18,119 |
| 2007 | 21,319 | 18,731 | 19,257 | 19,038 | 20,142 | 18,193 | 18,862 | 19,495 | 17,124 | 17,988 | 20,037 | 20,402 |
| 2008 | 20,549 | 17,535 | 20,545 | 19,302 | 18,987 | 17,740 | 17,918 | 16,574 | 13,575 | 16,327 | 18,726 | 17,639 |
| 2009 | 17,787 | 16,788 | 19,263 | 18,520 | 18,086 | 17,795 | 16,141 | 17,749 | 16,731 | 16,475 | 18,658 | 19,869 |
| 2010 | 16,019 | 18,092 | 17,249 | 19,598 | 18,550 | 18,745 | 17,367 | 17,705 | 15,781 | 17,325 | 17,072 | 19,302 |
| 2011 | 19,058 | 16,194 | 17,701 | 17,287 | 17,079 | 16,713 | 17,598 | 16,528 | 16,680 | 16,700 | 17,848 | 18,004 |
| 2012 | 17,799 | 16,099 | 17,454 | 19,476 | 18,339 | 17,815 | 19,903 | 16,268 | 17,949 | 19,468 | 19,439 | 19,048 |
| 2013 | 16,663 | 16,108 | 15,976 | 16,447 | 15,903 | 16,973 | 16,167 | 18,512 | 16,970 | 16,906 | 15,880 | 18,165 |
| 2014 | 18,118 | 15,785 | 17,873 | 16,278 | 18,341 | 17,303 | 15,643 | 18,268 | 15,712 | 17,008 | 16,236 | 19,162 |
| 2015 | 16,062 | 13,922 | 15,945 | 17,272 | 17,250 | 17,458 | 17,368 | 18,342 | 16,436 | 18,307 | 16,603 | 20,597 |
| 2016 | 18,562 | 17,442 | 20,158 | 20,943 | 19,879 | 19,755 | 22,100 | 16,988 | 18,944 | 19,853 | 21,155 | 21,170 |
| 2017 | 22,310 | 19,908 | 21,280 | 21,755 | 21,500 | 20,625 | 21,980 | 21,772 | 17,966 | 19,716 | 20,677 | 21,869 |
| 2018 | 21,610 | 18,819 | 21,123 | 24,203 | 23,191 | 20,589 | 22,344 | 22,660 | 19,946 | 20,739 | 23,158 | 25,582 |
| 2019 | 28,093 | 19,248 | 27,623 | 25,202 | 28,243 | 23,142 | 20,723 | 23,380 | 19,322 | 22,234 | 22,187 | 22,641 |
| 2020 | 22,706 | 20,439 | 22,531 | 16,991 | 18,481 | 19,649 | 19,602 | 17,687 | 19,303 | 22,842 | 21,960 | 24,421 |
| 2021 | 22,304 | 18,237 | 20,250 | 22,865 | 23,444 | 25,610 | 24,316 | 23,805 | 23,364 | 19,431 | 22,516 | 24,455 |
| 2022 | 24,397 | 19,265 | 20,253 | 23,421 | 21,900 | 20,917 | 20,097 | 20,417 | 15,872 | 23,788 | 21,026 | 21,122 |
| 2023 | 21,602 | 20,761 | 24,008 | 23,220 | 23,634 | 20,659 | 21,711 | 17,150 | 20,440 | 22,001 | 21,640 | 20,678 |
| 2024 | 22,469 | |||||||||||
| - = No Data Reported; -- = Not Applicable; NA = Not Available; W = Withheld to avoid disclosure of individual company data. |
| Release Date: 3/29/2024 |
| Next Release Date: 4/30/2024 |