|
Download Data (XLS File) |
|
||||||||
|
||||||||
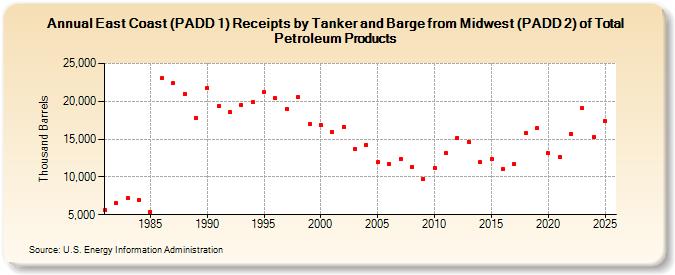
| East Coast (PADD 1) Receipts by Tanker and Barge from Midwest (PADD 2) of Total Petroleum Products (Thousand Barrels) | ||||||||
| Decade | Year-0 | Year-1 | Year-2 | Year-3 | Year-4 | Year-5 | Year-6 | Year-7 | Year-8 | Year-9 |
|---|---|---|---|---|---|---|---|---|---|---|
| 1980's | 5,580 | 6,540 | 7,154 | 6,988 | 5,419 | 23,019 | 22,380 | 21,025 | 17,824 | |
| 1990's | 21,737 | 19,350 | 18,539 | 19,487 | 19,862 | 21,194 | 20,377 | 18,959 | 20,528 | 16,940 |
| 2000's | 16,920 | 15,974 | 16,665 | 13,708 | 14,238 | 11,915 | 11,721 | 12,379 | 11,342 | 9,721 |
| 2010's | 11,236 | 13,120 | 15,204 | 14,602 | 11,971 | 12,364 | 11,013 | 11,734 | 15,758 | 16,421 |
| 2020's | 13,110 | 12,600 | 15,714 | 19,051 |
| - = No Data Reported; -- = Not Applicable; NA = Not Available; W = Withheld to avoid disclosure of individual company data. |
| Release Date: 3/29/2024 |
| Next Release Date: 8/30/2024 |