|
Download Data (XLS File) |
|
||||||||
|
||||||||
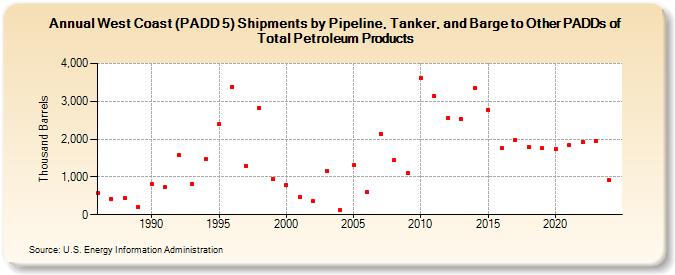
| West Coast (PADD 5) Shipments by Pipeline, Tanker, and Barge to Other PADDs of Total Petroleum Products (Thousand Barrels) | ||||||||
| Decade | Year-0 | Year-1 | Year-2 | Year-3 | Year-4 | Year-5 | Year-6 | Year-7 | Year-8 | Year-9 |
|---|---|---|---|---|---|---|---|---|---|---|
| 1980's | 574 | 425 | 434 | 202 | ||||||
| 1990's | 802 | 730 | 1,584 | 815 | 1,464 | 2,397 | 3,381 | 1,290 | 2,825 | 933 |
| 2000's | 792 | 459 | 351 | 1,168 | 112 | 1,308 | 599 | 2,142 | 1,444 | 1,103 |
| 2010's | 3,629 | 3,135 | 2,550 | 2,523 | 3,354 | 2,780 | 1,755 | 1,984 | 1,789 | 1,757 |
| 2020's | 1,727 | 1,837 | 1,936 | 1,936 |
| - = No Data Reported; -- = Not Applicable; NA = Not Available; W = Withheld to avoid disclosure of individual company data. |
| Release Date: 3/29/2024 |
| Next Release Date: 8/30/2024 |