|
Download Data (XLS File) |
|
||||||||
|
||||||||
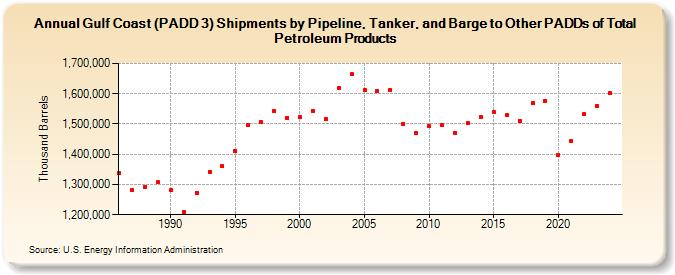
| Gulf Coast (PADD 3) Shipments by Pipeline, Tanker, and Barge to Other PADDs of Total Petroleum Products (Thousand Barrels) | ||||||||
| Decade | Year-0 | Year-1 | Year-2 | Year-3 | Year-4 | Year-5 | Year-6 | Year-7 | Year-8 | Year-9 |
|---|---|---|---|---|---|---|---|---|---|---|
| 1980's | 1,337,460 | 1,281,191 | 1,292,577 | 1,307,278 | ||||||
| 1990's | 1,281,796 | 1,208,918 | 1,272,954 | 1,342,638 | 1,360,023 | 1,411,854 | 1,495,748 | 1,506,346 | 1,542,068 | 1,520,647 |
| 2000's | 1,522,156 | 1,543,936 | 1,515,394 | 1,617,949 | 1,664,551 | 1,612,547 | 1,609,419 | 1,611,761 | 1,501,231 | 1,470,389 |
| 2010's | 1,491,961 | 1,495,218 | 1,471,724 | 1,502,972 | 1,521,500 | 1,538,137 | 1,528,281 | 1,511,305 | 1,570,050 | 1,576,884 |
| 2020's | 1,398,894 | 1,443,120 | 1,532,203 | 1,559,776 |
| - = No Data Reported; -- = Not Applicable; NA = Not Available; W = Withheld to avoid disclosure of individual company data. |
| Release Date: 8/30/2024 |
| Next Release Date: 8/29/2025 |