|
Download Data (XLS File) |
|
||||||||
|
||||||||
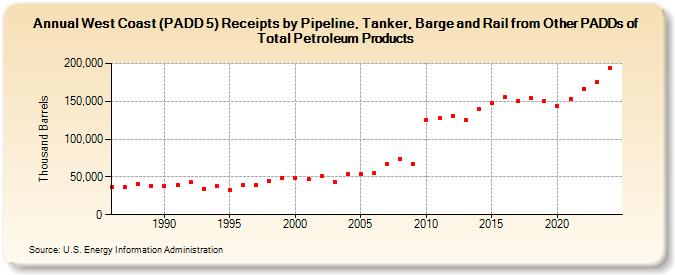
| West Coast (PADD 5) Receipts by Pipeline, Tanker, Barge and Rail from Other PADDs of Total Petroleum Products (Thousand Barrels) | ||||||||
| Decade | Year-0 | Year-1 | Year-2 | Year-3 | Year-4 | Year-5 | Year-6 | Year-7 | Year-8 | Year-9 |
|---|---|---|---|---|---|---|---|---|---|---|
| 1980's | 35,991 | 36,936 | 40,106 | 38,587 | ||||||
| 1990's | 37,955 | 39,829 | 42,718 | 34,412 | 37,926 | 32,127 | 39,456 | 38,920 | 45,213 | 48,936 |
| 2000's | 49,140 | 46,882 | 50,741 | 43,732 | 53,248 | 53,957 | 54,542 | 66,721 | 73,657 | 66,832 |
| 2010's | 125,735 | 127,410 | 130,968 | 124,844 | 139,204 | 147,468 | 155,526 | 149,878 | 154,034 | 150,121 |
| 2020's | 144,352 | 153,472 | 166,621 | 176,026 |
| - = No Data Reported; -- = Not Applicable; NA = Not Available; W = Withheld to avoid disclosure of individual company data. |
| Release Date: 3/29/2024 |
| Next Release Date: 8/30/2024 |