|
Download Data (XLS File) |
|
||||||||
|
||||||||
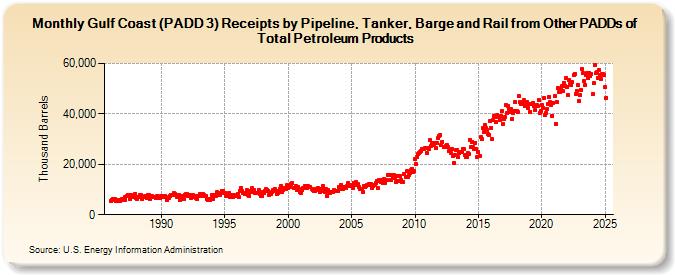
| Gulf Coast (PADD 3) Receipts by Pipeline, Tanker, Barge and Rail from Other PADDs of Total Petroleum Products (Thousand Barrels) | ||||||||
| Year | Jan | Feb | Mar | Apr | May | Jun | Jul | Aug | Sep | Oct | Nov | Dec |
|---|---|---|---|---|---|---|---|---|---|---|---|---|
| 1986 | 5,500 | 5,975 | 6,350 | 5,949 | 6,361 | 5,322 | 5,803 | 5,959 | 5,637 | 5,558 | 5,669 | 6,408 |
| 1987 | 6,381 | 5,893 | 7,086 | 7,520 | 7,895 | 7,436 | 6,231 | 7,737 | 7,063 | 7,440 | 7,071 | 8,393 |
| 1988 | 6,671 | 6,314 | 6,945 | 7,190 | 7,795 | 7,633 | 6,232 | 7,076 | 7,271 | 7,341 | 6,493 | 7,739 |
| 1989 | 7,768 | 6,398 | 7,198 | 7,500 | 7,071 | 7,051 | 6,983 | 6,579 | 7,478 | 6,482 | 6,676 | 6,444 |
| 1990 | 7,516 | 7,013 | 7,400 | 7,241 | 6,962 | 5,984 | 6,487 | 6,623 | 7,478 | 7,884 | 7,822 | 7,777 |
| 1991 | 8,535 | 8,369 | 7,775 | 7,120 | 7,051 | 7,664 | 6,010 | 7,437 | 6,286 | 6,076 | 7,845 | 8,215 |
| 1992 | 8,107 | 7,524 | 7,235 | 7,820 | 6,581 | 7,065 | 7,637 | 7,101 | 7,229 | 6,515 | 6,104 | 7,227 |
| 1993 | 8,181 | 7,432 | 7,775 | 8,079 | 7,667 | 7,359 | 7,355 | 6,209 | 5,976 | 6,286 | 5,738 | 6,324 |
| 1994 | 7,835 | 6,336 | 7,953 | 7,332 | 7,564 | 8,851 | 8,377 | 7,828 | 8,652 | 9,219 | 9,291 | 8,626 |
| 1995 | 8,724 | 7,611 | 8,122 | 7,623 | 8,739 | 7,122 | 7,312 | 8,016 | 7,015 | 7,745 | 7,470 | 7,401 |
| 1996 | 8,359 | 7,090 | 9,601 | 10,661 | 9,523 | 8,481 | 8,650 | 8,280 | 8,796 | 9,685 | 8,001 | 7,555 |
| 1997 | 9,362 | 8,867 | 10,564 | 9,858 | 9,738 | 8,605 | 8,774 | 8,725 | 9,757 | 8,290 | 7,547 | 7,439 |
| 1998 | 9,016 | 8,450 | 9,596 | 10,101 | 9,844 | 9,588 | 7,985 | 8,498 | 8,183 | 8,849 | 9,774 | 10,135 |
| 1999 | 9,223 | 8,087 | 8,543 | 9,517 | 10,351 | 11,463 | 9,038 | 9,730 | 10,543 | 10,179 | 10,050 | 11,631 |
| 2000 | 10,669 | 11,044 | 11,001 | 12,115 | 12,656 | 10,559 | 10,519 | 11,523 | 9,976 | 10,841 | 10,223 | 8,816 |
| 2001 | 8,617 | 9,752 | 10,666 | 10,456 | 11,374 | 11,262 | 10,679 | 11,357 | 10,974 | 11,148 | 10,371 | 9,811 |
| 2002 | 9,530 | 9,399 | 10,186 | 10,062 | 10,690 | 9,999 | 8,841 | 10,094 | 9,397 | 11,449 | 9,704 | 8,853 |
| 2003 | 10,099 | 7,305 | 9,709 | 9,147 | 8,647 | 8,951 | 9,033 | 9,711 | 9,465 | 9,493 | 9,397 | 9,363 |
| 2004 | 11,070 | 10,582 | 11,901 | 10,173 | 10,364 | 11,035 | 11,061 | 10,716 | 11,348 | 12,602 | 11,316 | 11,951 |
| 2005 | 11,301 | 10,541 | 12,739 | 11,782 | 12,974 | 12,278 | 12,156 | 10,982 | 10,025 | 10,237 | 10,108 | 9,026 |
| 2006 | 11,384 | 11,082 | 11,280 | 11,944 | 12,049 | 11,917 | 12,062 | 10,756 | 11,431 | 11,963 | 11,730 | 12,538 |
| 2007 | 13,310 | 10,619 | 13,580 | 13,182 | 13,177 | 13,597 | 12,710 | 14,133 | 12,762 | 13,830 | 15,722 | 15,763 |
| 2008 | 15,711 | 13,945 | 15,908 | 14,578 | 15,853 | 14,609 | 12,796 | 15,218 | 13,281 | 15,515 | 15,263 | 13,822 |
| 2009 | 12,965 | 13,083 | 16,047 | 15,098 | 17,179 | 15,105 | 15,885 | 16,383 | 17,611 | 18,270 | 16,853 | 17,323 |
| 2010 | 21,909 | 20,301 | 22,719 | 23,959 | 24,536 | 24,820 | 25,312 | 26,236 | 25,960 | 26,338 | 26,593 | 24,397 |
| 2011 | 26,470 | 26,172 | 29,531 | 27,152 | 28,339 | 28,429 | 27,474 | 28,500 | 26,341 | 28,336 | 30,310 | 31,297 |
| 2012 | 31,644 | 27,756 | 29,011 | 26,828 | 27,001 | 27,225 | 27,828 | 26,678 | 25,083 | 25,135 | 24,343 | 26,158 |
| 2013 | 23,223 | 20,602 | 23,646 | 25,676 | 25,577 | 22,787 | 24,304 | 25,022 | 24,825 | 26,233 | 25,926 | 23,753 |
| 2014 | 23,093 | 22,932 | 24,520 | 24,176 | 29,724 | 26,945 | 28,847 | 27,027 | 26,256 | 28,591 | 26,072 | 22,724 |
| 2015 | 24,868 | 23,318 | 30,707 | 30,059 | 34,257 | 32,647 | 35,519 | 34,456 | 33,575 | 31,908 | 31,614 | 37,248 |
| 2016 | 34,502 | 30,190 | 37,636 | 38,987 | 38,817 | 36,686 | 39,624 | 38,936 | 37,575 | 39,240 | 41,170 | 36,101 |
| 2017 | 37,867 | 38,652 | 43,447 | 40,291 | 43,287 | 41,779 | 40,896 | 41,830 | 38,049 | 40,465 | 40,970 | 44,741 |
| 2018 | 41,301 | 40,929 | 47,024 | 44,524 | 43,979 | 44,443 | 44,075 | 45,385 | 43,055 | 43,731 | 44,884 | 42,268 |
| 2019 | 44,016 | 40,805 | 44,056 | 43,735 | 44,417 | 43,296 | 41,626 | 43,713 | 43,005 | 45,611 | 40,338 | 41,076 |
| 2020 | 43,461 | 42,403 | 46,338 | 39,465 | 40,372 | 41,997 | 44,108 | 46,888 | 44,684 | 43,506 | 39,280 | 44,482 |
| 2021 | 47,025 | 36,130 | 44,870 | 50,334 | 48,545 | 48,551 | 49,994 | 51,053 | 48,934 | 52,386 | 51,215 | 54,314 |
| 2022 | 50,603 | 47,395 | 53,397 | 51,914 | 51,305 | 52,650 | 55,412 | 55,886 | 47,934 | 48,993 | 51,372 | 45,151 |
| 2023 | 47,319 | 49,380 | 57,972 | 56,147 | 52,829 | 51,294 | 55,477 | 56,034 | 54,226 | 56,295 | 54,876 | 55,595 |
| 2024 | 47,422 | |||||||||||
| - = No Data Reported; -- = Not Applicable; NA = Not Available; W = Withheld to avoid disclosure of individual company data. |
| Release Date: 3/29/2024 |
| Next Release Date: 4/30/2024 |