|
Download Data (XLS File) |
|
||||||||
|
||||||||
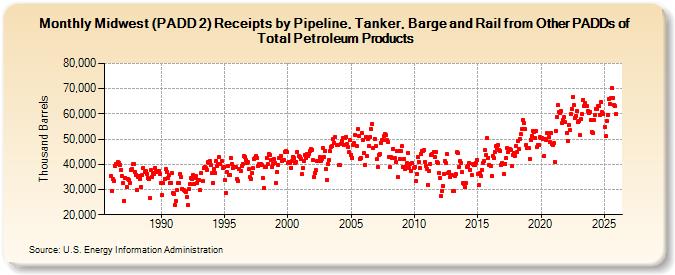
| Midwest (PADD 2) Receipts by Pipeline, Tanker, Barge and Rail from Other PADDs of Total Petroleum Products (Thousand Barrels) | ||||||||
| Year | Jan | Feb | Mar | Apr | May | Jun | Jul | Aug | Sep | Oct | Nov | Dec |
|---|---|---|---|---|---|---|---|---|---|---|---|---|
| 1986 | 35,384 | 29,421 | 34,304 | 33,513 | 39,308 | 40,103 | 40,170 | 40,789 | 40,326 | 39,829 | 37,808 | 35,197 |
| 1987 | 32,468 | 25,566 | 34,718 | 31,096 | 34,197 | 33,896 | 32,526 | 37,932 | 38,055 | 40,072 | 40,152 | 36,882 |
| 1988 | 35,954 | 29,839 | 34,777 | 35,203 | 34,287 | 31,131 | 35,841 | 38,547 | 37,015 | 37,473 | 36,173 | 34,699 |
| 1989 | 34,098 | 26,648 | 37,576 | 35,102 | 36,455 | 36,047 | 38,694 | 37,230 | 37,005 | 37,044 | 37,388 | 36,000 |
| 1990 | 32,482 | 27,841 | 32,428 | 34,342 | 37,961 | 36,864 | 34,629 | 35,592 | 32,512 | 32,713 | 36,482 | 28,783 |
| 1991 | 28,245 | 23,802 | 25,407 | 29,750 | 32,395 | 32,533 | 36,111 | 34,937 | 30,317 | 29,679 | 29,212 | 28,980 |
| 1992 | 27,200 | 23,771 | 30,196 | 32,132 | 34,426 | 34,090 | 35,925 | 32,090 | 34,635 | 35,457 | 32,455 | 33,829 |
| 1993 | 33,624 | 29,641 | 36,531 | 33,206 | 38,438 | 39,042 | 38,478 | 37,668 | 40,759 | 40,473 | 41,118 | 39,532 |
| 1994 | 36,620 | 32,577 | 38,044 | 36,680 | 41,431 | 39,411 | 40,051 | 42,831 | 39,947 | 41,193 | 38,677 | 38,786 |
| 1995 | 33,732 | 28,744 | 36,964 | 39,388 | 35,794 | 35,843 | 42,526 | 40,184 | 38,601 | 38,874 | 39,109 | 38,912 |
| 1996 | 34,117 | 33,494 | 38,000 | 37,255 | 39,225 | 40,165 | 43,105 | 42,825 | 41,894 | 40,567 | 40,815 | 38,106 |
| 1997 | 34,962 | 34,127 | 36,467 | 38,479 | 42,262 | 42,512 | 43,439 | 42,532 | 39,392 | 40,181 | 40,220 | 39,882 |
| 1998 | 34,597 | 30,651 | 38,752 | 39,118 | 42,439 | 39,970 | 43,991 | 43,880 | 41,708 | 38,992 | 40,143 | 42,084 |
| 1999 | 40,346 | 32,607 | 37,002 | 39,780 | 42,352 | 43,376 | 41,430 | 41,658 | 41,521 | 44,809 | 45,329 | 44,947 |
| 2000 | 40,435 | 41,023 | 40,353 | 38,686 | 41,461 | 43,054 | 42,369 | 40,620 | 41,038 | 44,988 | 43,174 | 43,027 |
| 2001 | 42,056 | 36,111 | 38,628 | 41,415 | 43,678 | 42,558 | 44,252 | 43,139 | 44,081 | 45,158 | 46,129 | 45,860 |
| 2002 | 41,650 | 34,843 | 36,419 | 37,635 | 41,473 | 41,360 | 42,792 | 41,478 | 42,148 | 46,594 | 42,962 | 45,357 |
| 2003 | 37,961 | 33,879 | 40,059 | 41,591 | 45,139 | 46,773 | 47,291 | 49,892 | 48,368 | 50,846 | 47,645 | 47,695 |
| 2004 | 39,571 | 39,624 | 48,253 | 49,105 | 50,553 | 47,610 | 50,451 | 50,837 | 48,109 | 46,757 | 44,897 | 49,464 |
| 2005 | 43,840 | 42,612 | 47,753 | 48,339 | 51,539 | 47,203 | 53,902 | 51,275 | 42,234 | 42,587 | 52,375 | 49,562 |
| 2006 | 44,398 | 39,771 | 50,958 | 43,286 | 49,843 | 47,216 | 50,678 | 53,983 | 56,091 | 46,462 | 50,232 | 47,222 |
| 2007 | 41,916 | 38,819 | 43,850 | 44,078 | 48,410 | 49,612 | 49,510 | 51,210 | 51,943 | 51,551 | 49,679 | 48,678 |
| 2008 | 42,959 | 38,777 | 42,728 | 42,364 | 46,228 | 42,415 | 40,952 | 45,260 | 34,870 | 45,398 | 42,238 | 45,170 |
| 2009 | 47,129 | 38,853 | 42,144 | 37,956 | 39,120 | 40,602 | 44,578 | 38,470 | 40,171 | 37,265 | 40,422 | 38,574 |
| 2010 | 38,932 | 33,419 | 36,257 | 42,725 | 40,934 | 38,625 | 44,001 | 45,354 | 45,476 | 45,683 | 41,006 | 39,508 |
| 2011 | 38,218 | 31,968 | 37,312 | 40,291 | 43,549 | 44,085 | 44,902 | 43,089 | 44,740 | 41,030 | 40,397 | 36,539 |
| 2012 | 34,640 | 27,328 | 29,516 | 31,343 | 36,308 | 41,140 | 40,346 | 43,943 | 36,393 | 37,114 | 34,944 | 35,731 |
| 2013 | 29,238 | 29,482 | 35,180 | 36,090 | 44,699 | 44,312 | 39,065 | 41,219 | 40,523 | 36,750 | 32,541 | 32,323 |
| 2014 | 30,803 | 32,560 | 38,917 | 39,235 | 40,539 | 37,913 | 35,825 | 40,106 | 39,617 | 39,918 | 40,606 | 41,767 |
| 2015 | 36,265 | 31,683 | 36,364 | 35,452 | 37,873 | 40,340 | 41,327 | 45,505 | 43,640 | 50,357 | 42,676 | 39,901 |
| 2016 | 39,385 | 35,427 | 43,311 | 42,421 | 44,949 | 47,182 | 46,369 | 47,488 | 45,842 | 45,302 | 39,694 | 40,481 |
| 2017 | 40,199 | 35,957 | 40,307 | 42,500 | 46,278 | 44,937 | 45,952 | 45,821 | 39,161 | 43,874 | 44,456 | 43,472 |
| 2018 | 47,208 | 44,720 | 49,216 | 45,877 | 49,904 | 51,887 | 54,015 | 57,389 | 56,264 | 53,818 | 47,775 | 46,361 |
| 2019 | 46,296 | 42,202 | 49,836 | 51,323 | 53,276 | 52,764 | 50,624 | 53,026 | 46,711 | 47,713 | 47,499 | 50,671 |
| 2020 | 50,581 | 50,443 | 49,957 | 43,229 | 50,111 | 49,727 | 52,281 | 50,844 | 48,963 | 52,616 | 48,094 | 47,540 |
| 2021 | 48,340 | 40,972 | 53,369 | 58,701 | 63,404 | 60,849 | 60,321 | 61,076 | 56,260 | 57,467 | 58,629 | 56,628 |
| 2022 | 52,404 | 49,387 | 55,519 | 53,588 | 59,825 | 62,069 | 66,708 | 63,350 | 58,423 | 59,075 | 61,194 | 56,700 |
| 2023 | 57,040 | 51,465 | 57,872 | 59,839 | 65,623 | 63,314 | 64,251 | 62,979 | 61,020 | 60,198 | 60,714 | 57,620 |
| 2024 | 52,665 | |||||||||||
| - = No Data Reported; -- = Not Applicable; NA = Not Available; W = Withheld to avoid disclosure of individual company data. |
| Release Date: 3/29/2024 |
| Next Release Date: 4/30/2024 |