|
Download Data (XLS File) |
|
||||||||
|
||||||||
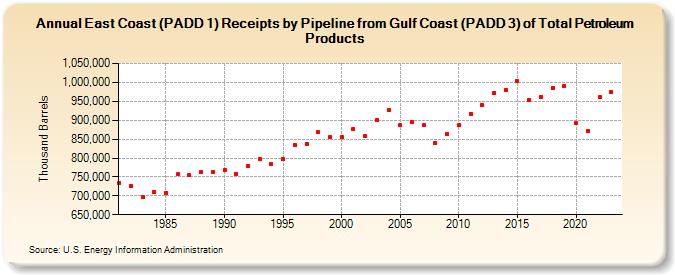
| East Coast (PADD 1) Receipts by Pipeline from Gulf Coast (PADD 3) of Total Petroleum Products (Thousand Barrels) | ||||||||
| Decade | Year-0 | Year-1 | Year-2 | Year-3 | Year-4 | Year-5 | Year-6 | Year-7 | Year-8 | Year-9 |
|---|---|---|---|---|---|---|---|---|---|---|
| 1980's | 734,761 | 725,852 | 696,410 | 710,775 | 708,478 | 756,853 | 755,574 | 762,281 | 764,105 | |
| 1990's | 767,087 | 757,383 | 778,663 | 797,440 | 783,918 | 796,751 | 835,094 | 838,012 | 867,464 | 854,377 |
| 2000's | 854,777 | 877,094 | 857,497 | 899,578 | 925,836 | 887,446 | 894,920 | 886,434 | 838,369 | 863,943 |
| 2010's | 885,979 | 917,065 | 940,688 | 972,004 | 981,144 | 1,002,381 | 953,490 | 961,931 | 986,036 | 991,272 |
| 2020's | 891,763 | 872,711 | 960,334 | 975,226 |
| - = No Data Reported; -- = Not Applicable; NA = Not Available; W = Withheld to avoid disclosure of individual company data. |
| Release Date: 3/29/2024 |
| Next Release Date: 8/30/2024 |