|
Download Data (XLS File) |
|
||||||||
|
||||||||
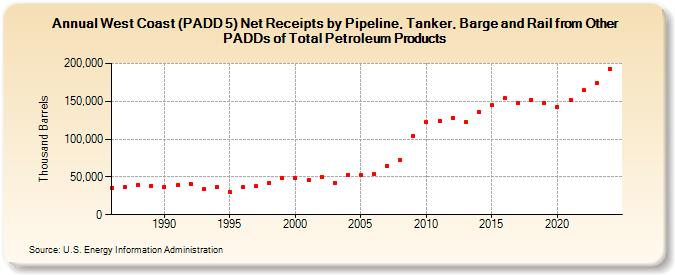
| West Coast (PADD 5) Net Receipts by Pipeline, Tanker, Barge and Rail from Other PADDs of Total Petroleum Products (Thousand Barrels) | ||||||||
| Decade | Year-0 | Year-1 | Year-2 | Year-3 | Year-4 | Year-5 | Year-6 | Year-7 | Year-8 | Year-9 |
|---|---|---|---|---|---|---|---|---|---|---|
| 1980's | 35,417 | 36,511 | 39,672 | 38,385 | ||||||
| 1990's | 37,153 | 39,099 | 41,134 | 33,597 | 36,462 | 29,730 | 36,075 | 37,630 | 42,388 | 48,003 |
| 2000's | 48,348 | 46,423 | 50,390 | 42,564 | 53,136 | 52,649 | 53,943 | 64,579 | 72,213 | 104,688 |
| 2010's | 122,105 | 124,275 | 128,418 | 122,321 | 135,850 | 144,688 | 153,771 | 147,895 | 152,245 | 148,364 |
| 2020's | 142,625 | 151,635 | 164,685 | 173,761 |
| - = No Data Reported; -- = Not Applicable; NA = Not Available; W = Withheld to avoid disclosure of individual company data. |
| Release Date: 8/30/2024 |
| Next Release Date: 8/29/2025 |