|
Download Data (XLS File) |
|
||||||||
|
||||||||
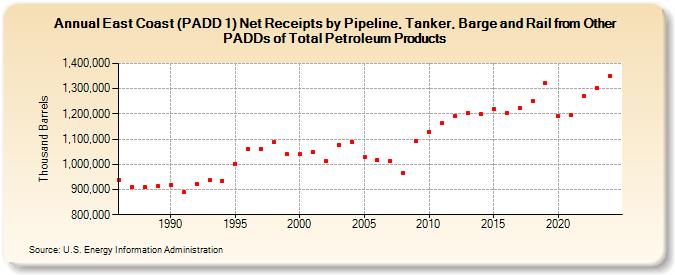
| East Coast (PADD 1) Net Receipts by Pipeline, Tanker, Barge and Rail from Other PADDs of Total Petroleum Products (Thousand Barrels) | ||||||||
| Decade | Year-0 | Year-1 | Year-2 | Year-3 | Year-4 | Year-5 | Year-6 | Year-7 | Year-8 | Year-9 |
|---|---|---|---|---|---|---|---|---|---|---|
| 1980's | 938,525 | 908,861 | 909,109 | 912,139 | ||||||
| 1990's | 919,360 | 888,211 | 923,299 | 937,790 | 935,043 | 1,001,349 | 1,061,604 | 1,062,617 | 1,088,126 | 1,038,984 |
| 2000's | 1,039,841 | 1,049,480 | 1,013,037 | 1,077,257 | 1,089,764 | 1,028,205 | 1,017,660 | 1,013,849 | 965,002 | 1,090,837 |
| 2010's | 1,129,620 | 1,162,450 | 1,190,708 | 1,203,813 | 1,197,911 | 1,218,891 | 1,203,029 | 1,222,428 | 1,250,910 | 1,322,210 |
| 2020's | 1,189,822 | 1,195,351 | 1,269,663 | 1,299,694 |
| - = No Data Reported; -- = Not Applicable; NA = Not Available; W = Withheld to avoid disclosure of individual company data. |
| Release Date: 6/28/2024 |
| Next Release Date: 8/30/2024 |