|
Download Data (XLS File) |
|
||||||||
|
||||||||
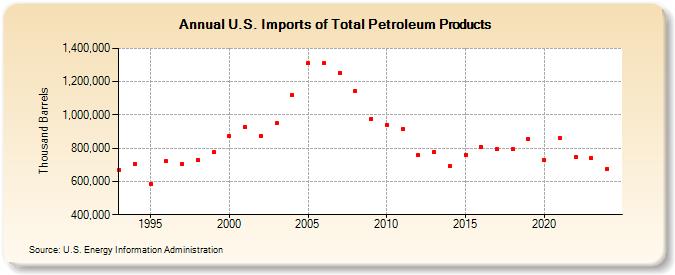
| U.S. Imports of Total Petroleum Products (Thousand Barrels) | ||||||||
| Decade | Year-0 | Year-1 | Year-2 | Year-3 | Year-4 | Year-5 | Year-6 | Year-7 | Year-8 | Year-9 |
|---|---|---|---|---|---|---|---|---|---|---|
| 1990's | 669,224 | 705,549 | 585,943 | 721,289 | 706,671 | 730,862 | 774,411 | |||
| 2000's | 874,270 | 928,144 | 872,363 | 948,805 | 1,119,041 | 1,309,570 | 1,310,001 | 1,254,553 | 1,146,300 | 977,435 |
| 2010's | 941,677 | 912,788 | 758,097 | 776,974 | 692,278 | 761,325 | 807,019 | 793,970 | 793,551 | 854,231 |
| 2020's | 727,623 | 861,428 | 747,347 | 743,079 |
| - = No Data Reported; -- = Not Applicable; NA = Not Available; W = Withheld to avoid disclosure of individual company data. |
| Release Date: 3/29/2024 |
| Next Release Date: 8/30/2024 |