|
Download Data (XLS File) |
|
||||||||
|
||||||||
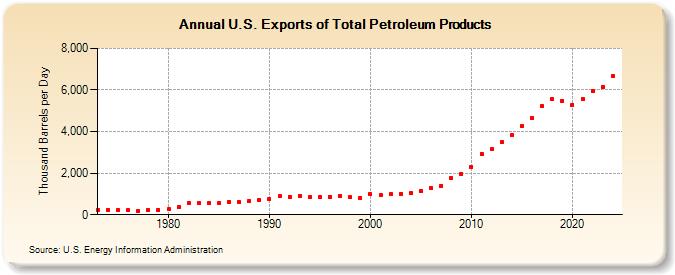
| U.S. Exports of Total Petroleum Products (Thousand Barrels per Day) | ||||||||
| Decade | Year-0 | Year-1 | Year-2 | Year-3 | Year-4 | Year-5 | Year-6 | Year-7 | Year-8 | Year-9 |
|---|---|---|---|---|---|---|---|---|---|---|
| 1970's | 229 | 218 | 204 | 215 | 193 | 204 | 236 | |||
| 1980's | 258 | 367 | 579 | 575 | 541 | 577 | 631 | 613 | 661 | 717 |
| 1990's | 748 | 885 | 861 | 904 | 843 | 855 | 871 | 896 | 835 | 822 |
| 2000's | 990 | 951 | 975 | 1,014 | 1,021 | 1,133 | 1,292 | 1,405 | 1,773 | 1,980 |
| 2010's | 2,311 | 2,939 | 3,137 | 3,487 | 3,824 | 4,273 | 4,670 | 5,218 | 5,553 | 5,490 |
| 2020's | 5,292 | 5,573 | 5,944 | 6,092 |
| - = No Data Reported; -- = Not Applicable; NA = Not Available; W = Withheld to avoid disclosure of individual company data. |
| Release Date: 3/29/2024 |
| Next Release Date: 8/30/2024 |