|
Download Data (XLS File) |
|
||||||||
|
||||||||
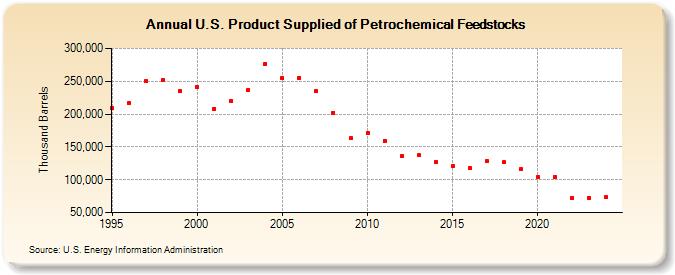
| U.S. Product Supplied of Petrochemical Feedstocks (Thousand Barrels) | ||||||||
| Decade | Year-0 | Year-1 | Year-2 | Year-3 | Year-4 | Year-5 | Year-6 | Year-7 | Year-8 | Year-9 |
|---|---|---|---|---|---|---|---|---|---|---|
| 1990's | 208,581 | 216,593 | 250,059 | 251,823 | 234,922 | |||||
| 2000's | 240,883 | 207,803 | 219,514 | 236,863 | 276,621 | 254,672 | 255,559 | 234,916 | 202,129 | 162,837 |
| 2010's | 171,164 | 159,558 | 135,806 | 137,114 | 126,780 | 120,886 | 118,225 | 128,251 | 126,236 | 115,776 |
| 2020's | 104,825 | 104,845 | 72,522 | 73,717 |
| - = No Data Reported; -- = Not Applicable; NA = Not Available; W = Withheld to avoid disclosure of individual company data. |
| Release Date: 3/29/2024 |
| Next Release Date: 8/30/2024 |