|
Download Data (XLS File) |
|
||||||||
|
||||||||
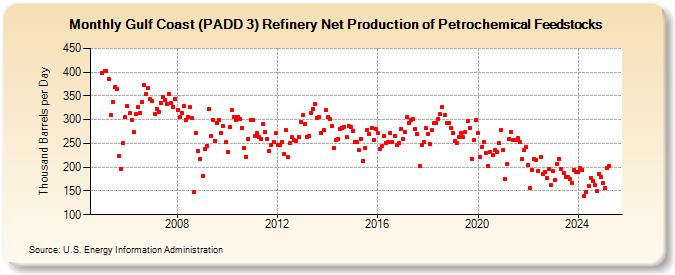
| Gulf Coast (PADD 3) Refinery Net Production of Petrochemical Feedstocks (Thousand Barrels per Day) | ||||||||
| Year | Jan | Feb | Mar | Apr | May | Jun | Jul | Aug | Sep | Oct | Nov | Dec |
|---|---|---|---|---|---|---|---|---|---|---|---|---|
| 2005 | 399 | 402 | 402 | 386 | 310 | 338 | 368 | 364 | 224 | 196 | 251 | 305 |
| 2006 | 329 | 313 | 300 | 274 | 311 | 326 | 315 | 337 | 372 | 355 | 367 | 344 |
| 2007 | 340 | 312 | 323 | 317 | 336 | 348 | 341 | 332 | 355 | 335 | 327 | 343 |
| 2008 | 320 | 305 | 315 | 329 | 299 | 305 | 326 | 304 | 148 | 272 | 234 | 218 |
| 2009 | 181 | 238 | 244 | 323 | 265 | 300 | 256 | 294 | 300 | 271 | 286 | 253 |
| 2010 | 233 | 284 | 320 | 306 | 300 | 306 | 301 | 282 | 240 | 221 | 260 | 299 |
| 2011 | 300 | 266 | 271 | 264 | 260 | 291 | 274 | 260 | 234 | 247 | 253 | 271 |
| 2012 | 246 | 247 | 254 | 227 | 278 | 221 | 251 | 263 | 257 | 256 | 263 | 296 |
| 2013 | 309 | 291 | 263 | 266 | 315 | 323 | 332 | 304 | 306 | 272 | 279 | 320 |
| 2014 | 305 | 301 | 286 | 240 | 257 | 260 | 281 | 283 | 285 | 263 | 286 | 284 |
| 2015 | 276 | 253 | 253 | 236 | 260 | 214 | 241 | 279 | 269 | 283 | 258 | 280 |
| 2016 | 272 | 238 | 245 | 265 | 251 | 252 | 271 | 253 | 266 | 246 | 250 | 280 |
| 2017 | 260 | 275 | 306 | 292 | 299 | 301 | 280 | 270 | 202 | 247 | 254 | 282 |
| 2018 | 270 | 249 | 278 | 293 | 292 | 302 | 311 | 326 | 310 | 294 | 292 | 283 |
| 2019 | 271 | 256 | 250 | 264 | 272 | 263 | 274 | 298 | 282 | 218 | 257 | 300 |
| 2020 | 273 | 221 | 243 | 253 | 230 | 203 | 231 | 226 | 237 | 233 | 250 | 278 |
| 2021 | 237 | 176 | 206 | 259 | 274 | 257 | 257 | 261 | 254 | 217 | 236 | 242 |
| 2022 | 205 | 156 | 194 | 218 | 215 | 193 | 221 | 185 | 189 | 178 | 197 | 162 |
| 2023 | 191 | 173 | 206 | 217 | 197 | 188 | 180 | 179 | 175 | 167 | 195 | 190 |
| 2024 | 189 | 198 | 194 | 139 | 148 | 160 | ||||||
| - = No Data Reported; -- = Not Applicable; NA = Not Available; W = Withheld to avoid disclosure of individual company data. |
| Release Date: 8/30/2024 |
| Next Release Date: 9/30/2024 |