|
Download Data (XLS File) |
|
||||||||
|
||||||||
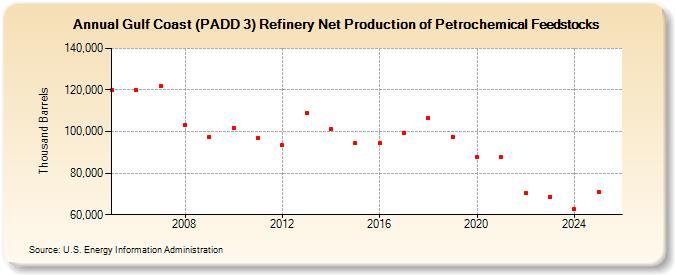
| Gulf Coast (PADD 3) Refinery Net Production of Petrochemical Feedstocks (Thousand Barrels) | ||||||||
| Decade | Year-0 | Year-1 | Year-2 | Year-3 | Year-4 | Year-5 | Year-6 | Year-7 | Year-8 | Year-9 |
|---|---|---|---|---|---|---|---|---|---|---|
| 2000's | 119,873 | 119,945 | 122,014 | 102,984 | 97,596 | |||||
| 2010's | 101,920 | 97,119 | 93,383 | 108,902 | 101,310 | 94,420 | 94,289 | 99,433 | 106,556 | 97,551 |
| 2020's | 87,865 | 87,571 | 70,477 | 68,644 |
| - = No Data Reported; -- = Not Applicable; NA = Not Available; W = Withheld to avoid disclosure of individual company data. |
| Release Date: 3/29/2024 |
| Next Release Date: 8/30/2024 |