|
Download Data (XLS File) |
|
||||||||
|
||||||||
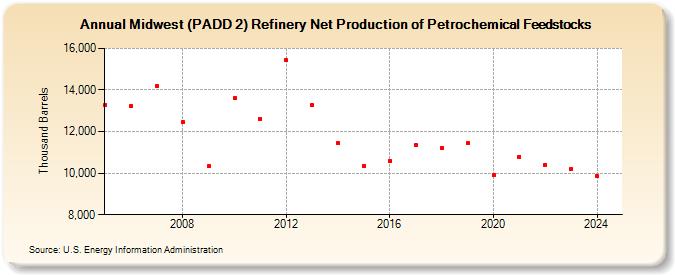
| Midwest (PADD 2) Refinery Net Production of Petrochemical Feedstocks (Thousand Barrels) | ||||||||
| Decade | Year-0 | Year-1 | Year-2 | Year-3 | Year-4 | Year-5 | Year-6 | Year-7 | Year-8 | Year-9 |
|---|---|---|---|---|---|---|---|---|---|---|
| 2000's | 13,282 | 13,210 | 14,171 | 12,449 | 10,332 | |||||
| 2010's | 13,601 | 12,623 | 15,426 | 13,255 | 11,443 | 10,350 | 10,585 | 11,350 | 11,212 | 11,433 |
| 2020's | 9,907 | 10,792 | 10,398 | 10,188 |
| - = No Data Reported; -- = Not Applicable; NA = Not Available; W = Withheld to avoid disclosure of individual company data. |
| Release Date: 3/29/2024 |
| Next Release Date: 8/30/2024 |